The Financial Report
Pry's Financial Report is an interactive three-way forecast. A three-way forecast combines three key reports into one consolidated forecast. The Financial Report links your profit & loss, balance sheet, and cashflow projection.
Adjusting the Date Range
The Date Range selector allows you to adjust the time period of your financial report.
Forecasting more years
To add additional years to your forecast, click on the "+" icon on the right of the date range selector and click on the green check to confirm add range year.
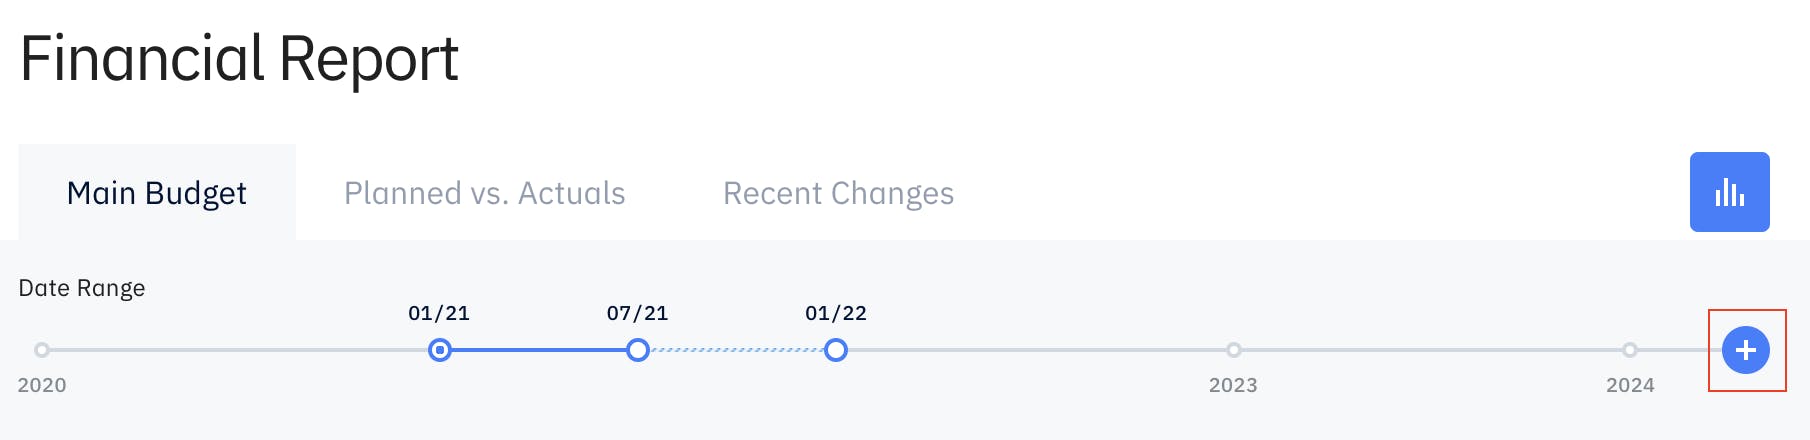
There are 3 circles on the date range selector and each circle represent a month/year:
- Left circle represents the starting month
- Middle circle represents the trigger point between actuals and forecasts
- Right circle represents the ending month
To extend your forecasts, click and drag the right circle to the right. You can forecast up to 5 years on Pry.
Top Level Accounts
Pry has eight top level accounts that have important accounting implications and cannot be deleted. You can rename or add sub accounts within these top level accounts.
Banks
"Banks" is a financial account. The values are usually shown as a positive cumulative sum representing a debit balance. Bank accounts on Pry distinct from Asset accounts and not a sub account of assets.
Credit Cards
"Credit cards" is a financial account. The values are usually shown as a positive cumulative sum representing a credit balance. Credit cards on Pry are distinct from Liability accounts and not a sub account of liabilities.
Revenue
Revenue is a category account. The values are usually shown as a positive sum.
Cost of Goods Sold
"Cost of Goods Sold" (COGS) is a category account. There is a separate department tag that is also called COGS. Transactions tagged as COGS should usually be in the COGS account.
Expense
Expense is a category account. The values are usually shown as a negative sum. Most transactions for companies are categorized within the Expense category.
Assets
Assets is a category account. The values are usually shown as a positive debit balance. Assets include all assets except Bank Accounts. Examples include Accounts Receivable, Inventory, or Equipment.
Liabilities
Liabilities is a category account. The values are usually shown as a positive credit balance. Liabilities include all assets except Credit Cards. Examples include Accounts Payable, Deferred Revenue, or Loans.
Equity
Equity is a category account. The values are usually shown as a positive credit balance. Examples include common stock held in treasury and retained earnings.
Financial Report Sections
The Financial Report is broken down into 3 main sections reflecting key data from the three main financial reports. The Available Balance, Net Income, and Change in Cashflow sections.
Available Balance
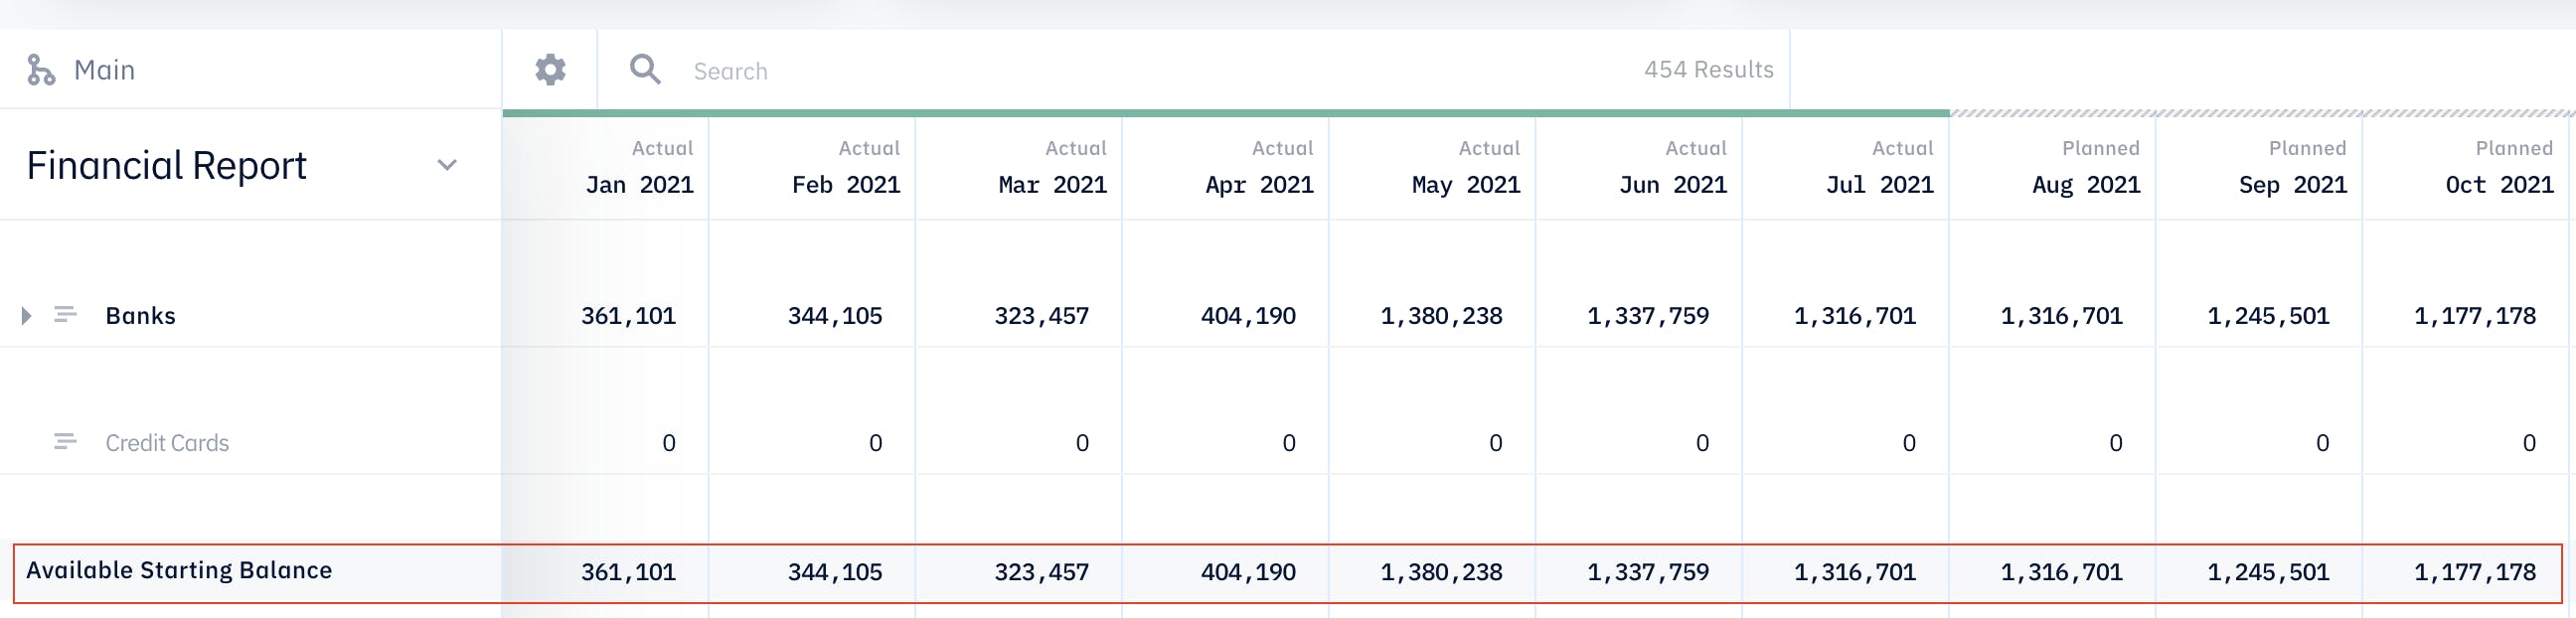
The Available Balance Section contains the Banks and Credit Cards. It shows the total Banks balance less the Credit Card balance. By default, Pry's Available Balance is a cumulative balance showing the start of month balance. This can be customized to show the end of month balance instead.
The Available Balance Section shows key data usually found on the Balance Sheet.
Net Income
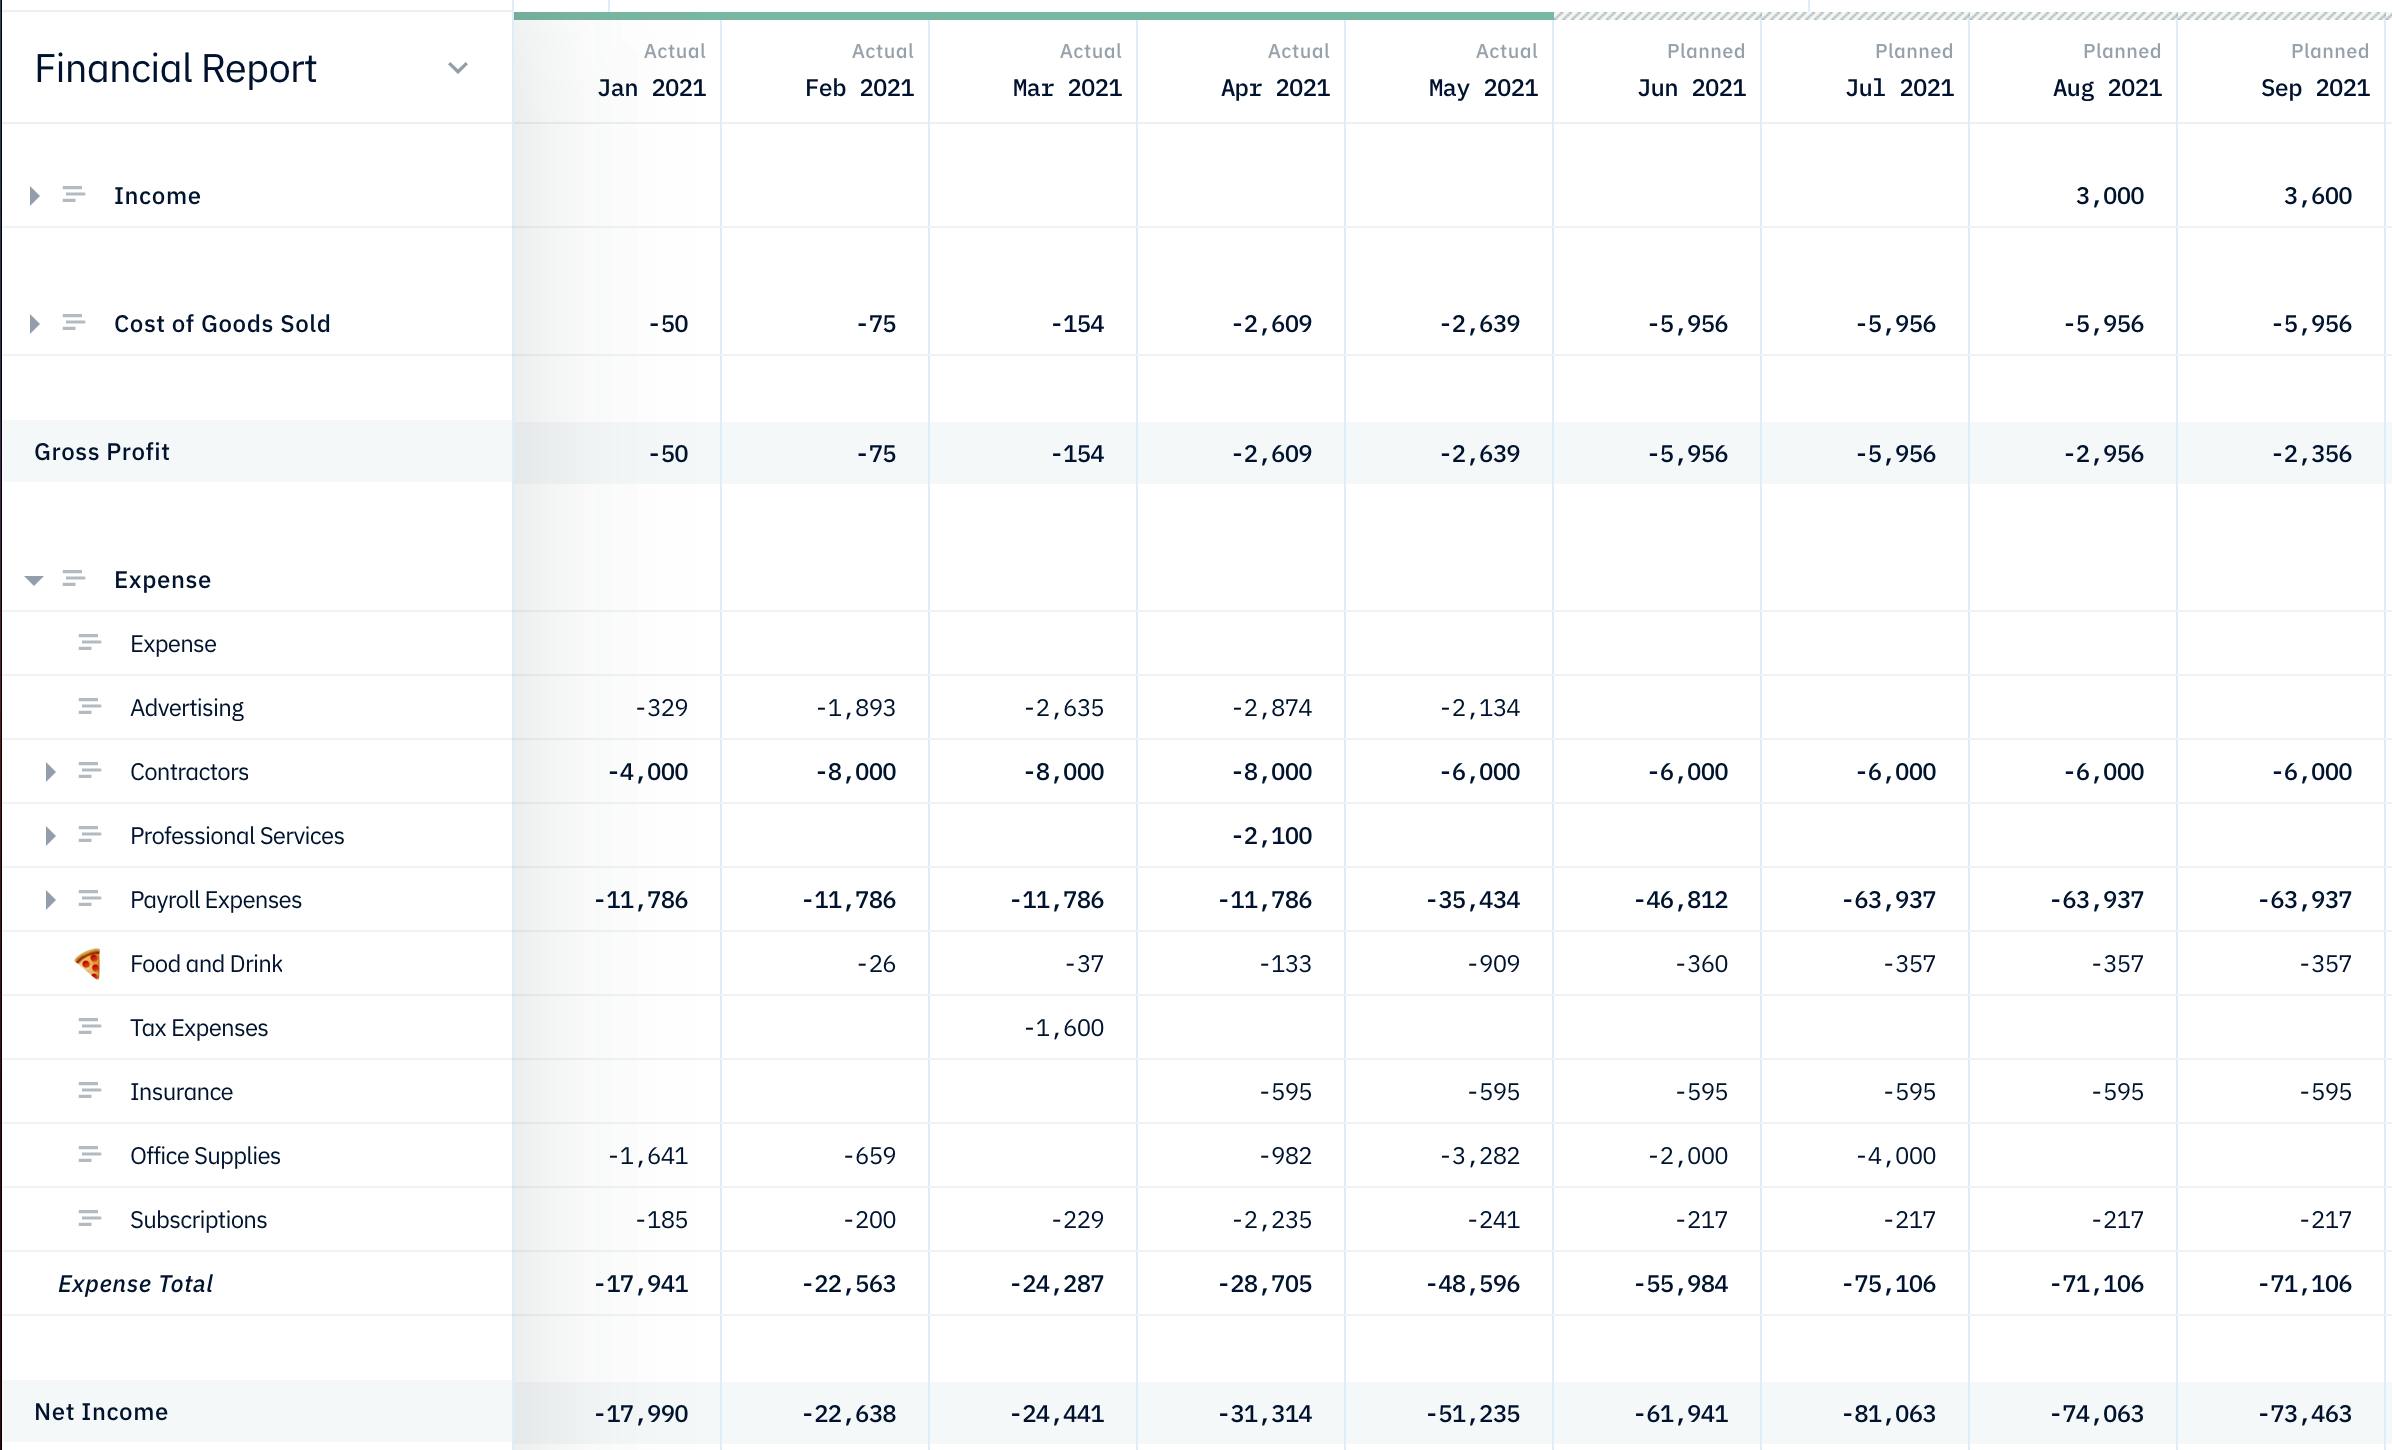
The Net Income (Profit & Loss) Section contains the Revenue, Cost of Revenue, and Expense accounts. It contains the Gross Profit Section and shows the Net Income for the company. The Net Income section is identical to a Profit & Loss Report.
Change in Cashflow

The Change in Cashflow Section references the Net Income Section and contains the Assets, Liabilities, and Equity accounts. The Change in Assets and Change in Liabilities & Equity sections show the change in the balance with respect to cash for the month.
This last section contains key information usually found on the Cashflow Statement.
The Available Starting Balance for the month plush the change in cashflow will equal the Available Starting Balance for the following month.
Forecasts vs Actuals
After your financial plan is built, you can review your forecasts vs actuals and compare them side by side, month over month. Visit the Forecasts vs Actuals page by pressing on the tab under Financial Report next to the 'Main Forecast' tab.
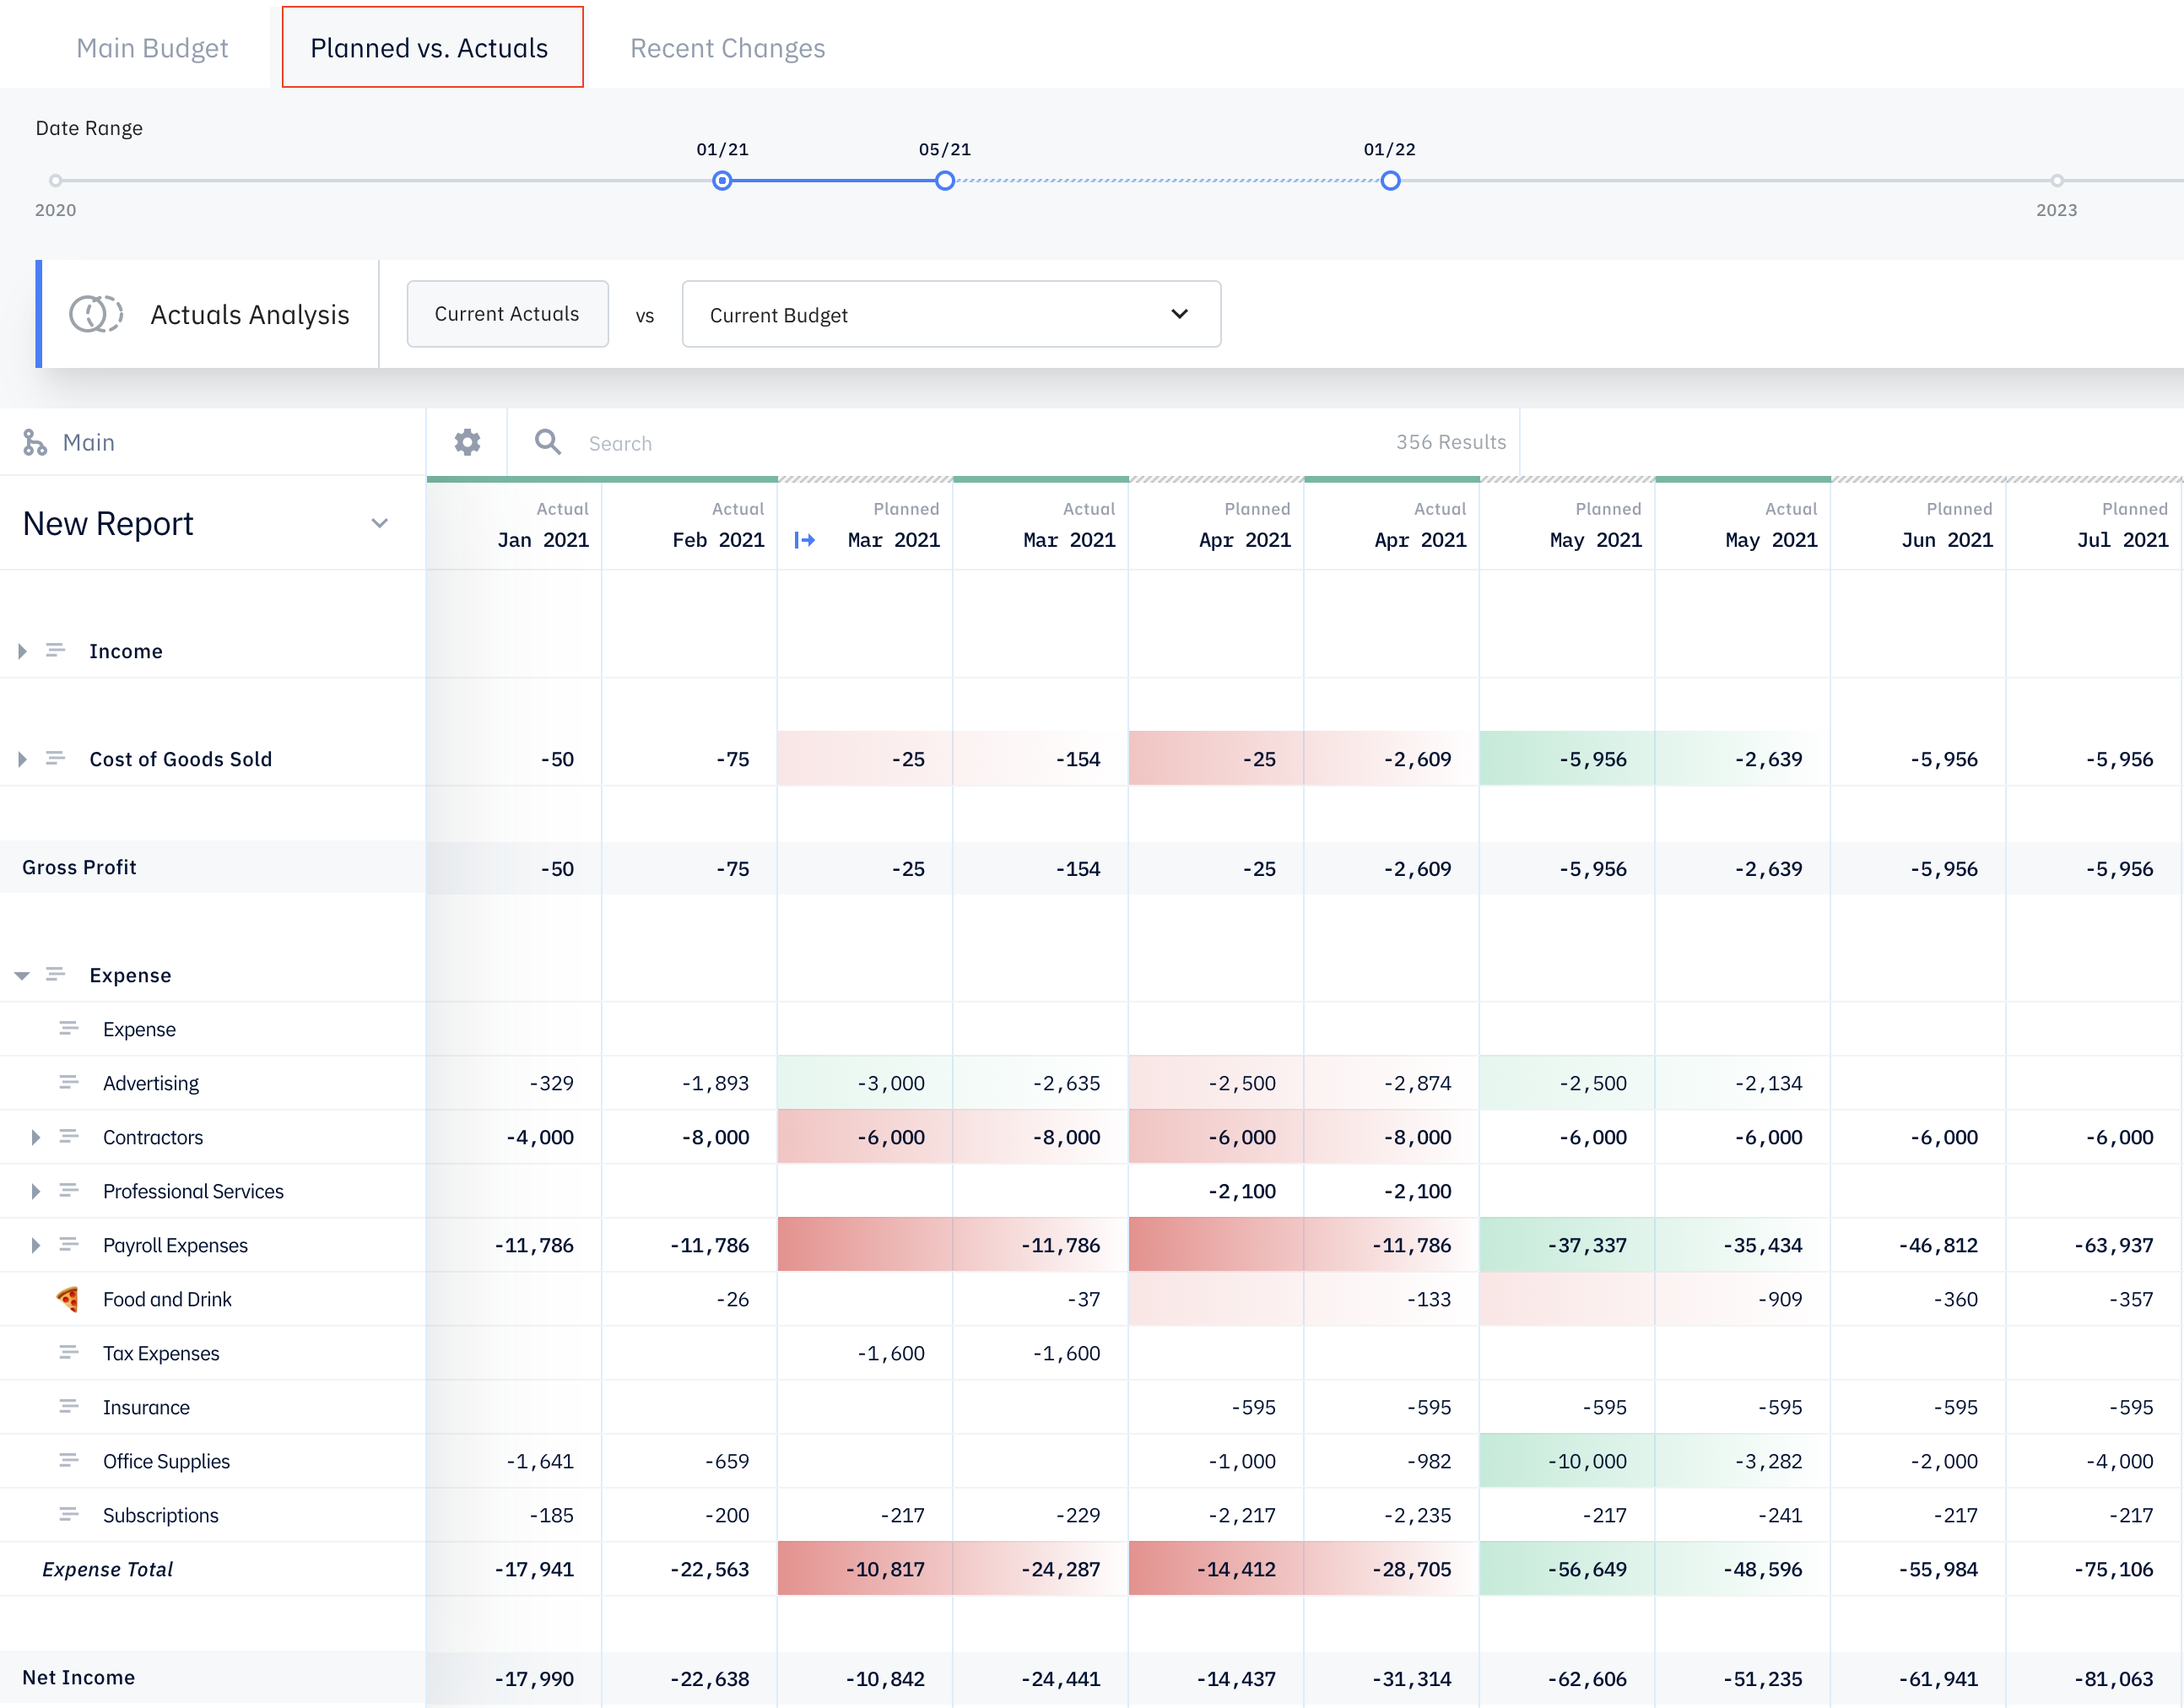
Variances
- Green highlight means the actuals were better than forecasted; red means the actuals were worse than forecasted
- The darker the color, the higher the variance; the lighter the color, the lower the variance
- If the variance is less than $100, it's not highlighted.