Customized layout
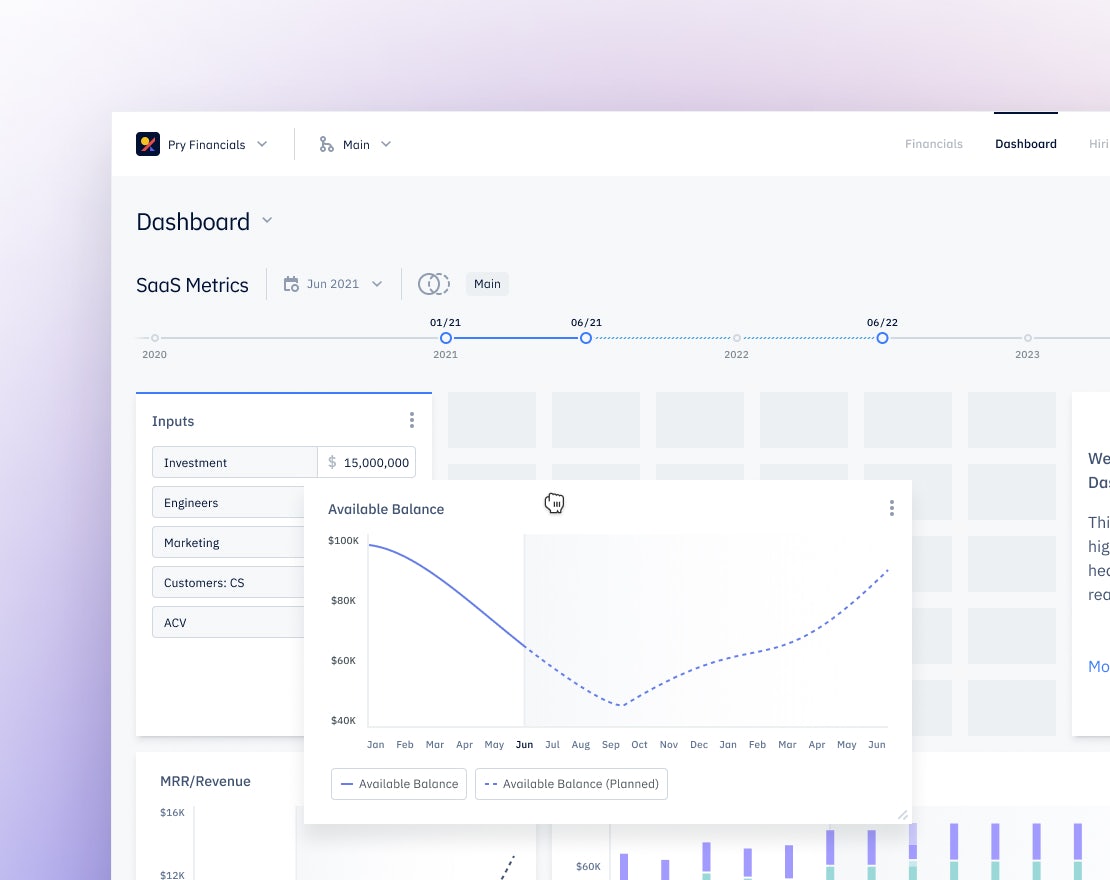
You can resize and drag and drop your charts to rearrange the layout.
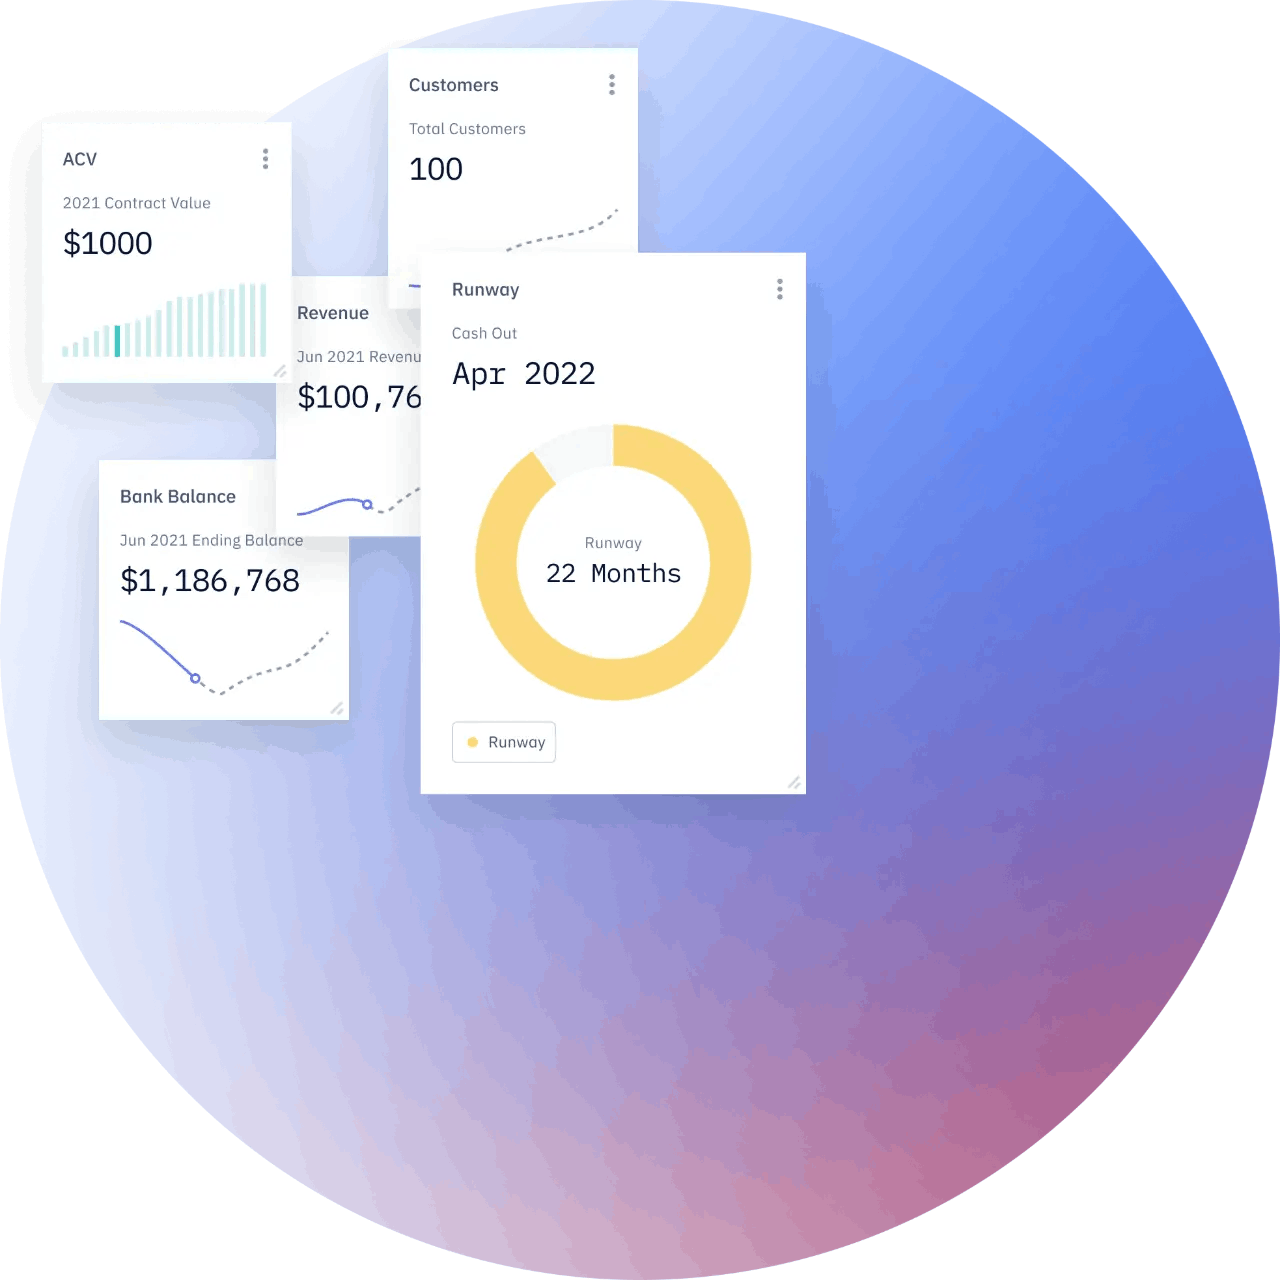

Customize your KPI dashboard to suit your company's needs. Easily create interactive dashboards full of beautiful charts backed by your real-time financial data.
Pry dashboards is a premium product on par with best in class business intelligence tools.
You can resize and drag and drop your charts to rearrange the layout.
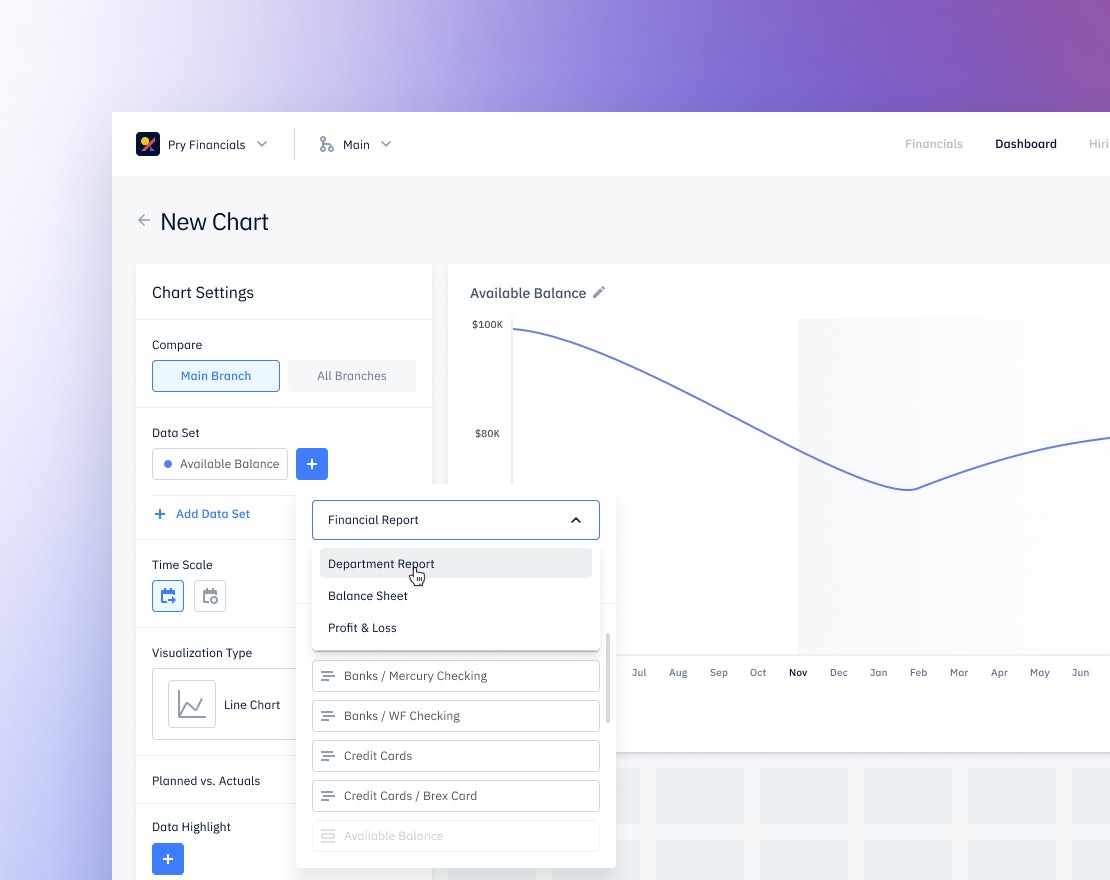
Create a chart using any of your Financial Report, Hiring Plan, or Financial Modeling data.
Add Financial Model inputs directly on the dashboard to see how small changes can have wide ranging impact on long term goals.
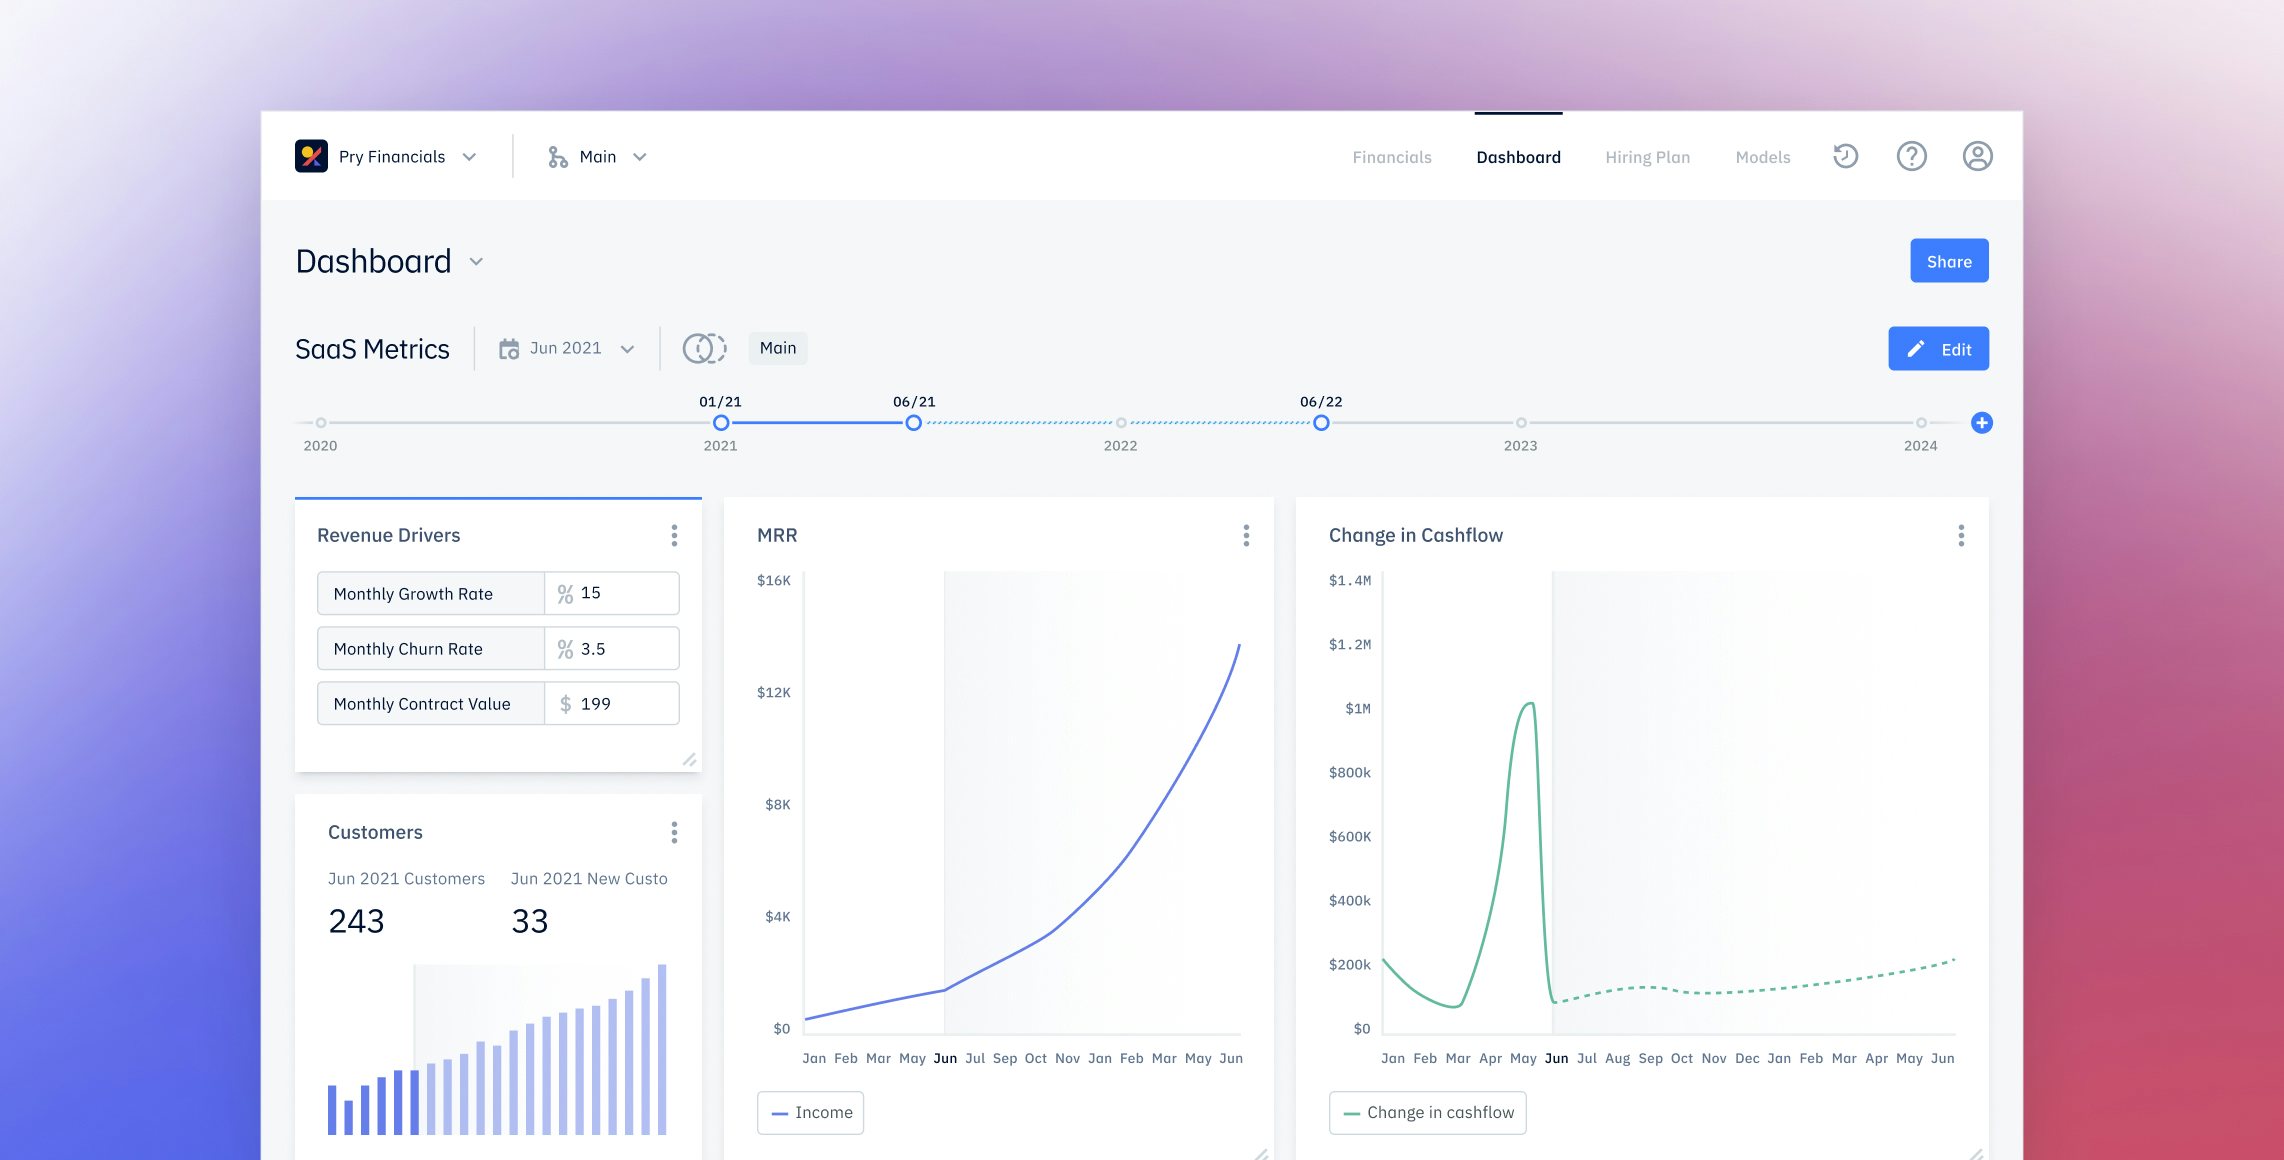
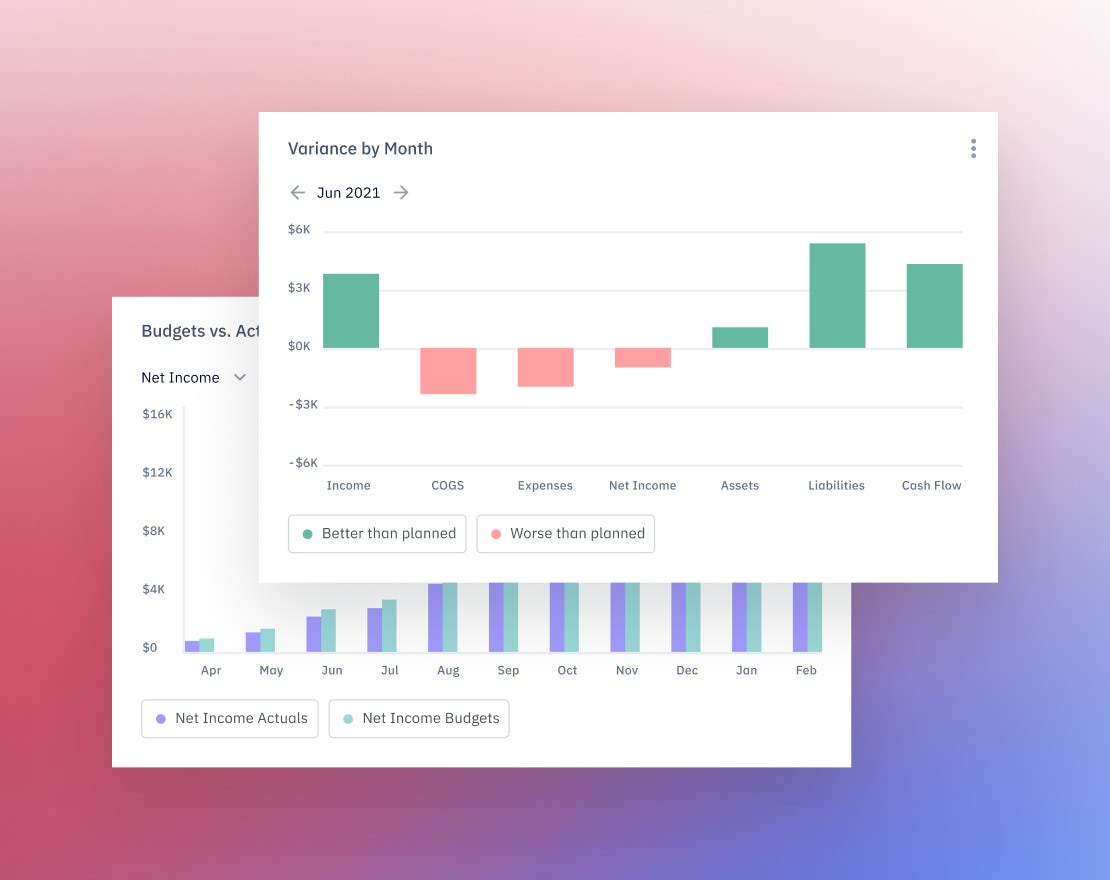
Pry charts are purpose-built for financial data. It just takes one click to build complex charts such as forecasts vs actuals and scenario comparisons.
Understand forecasts vs actuals at a glance.
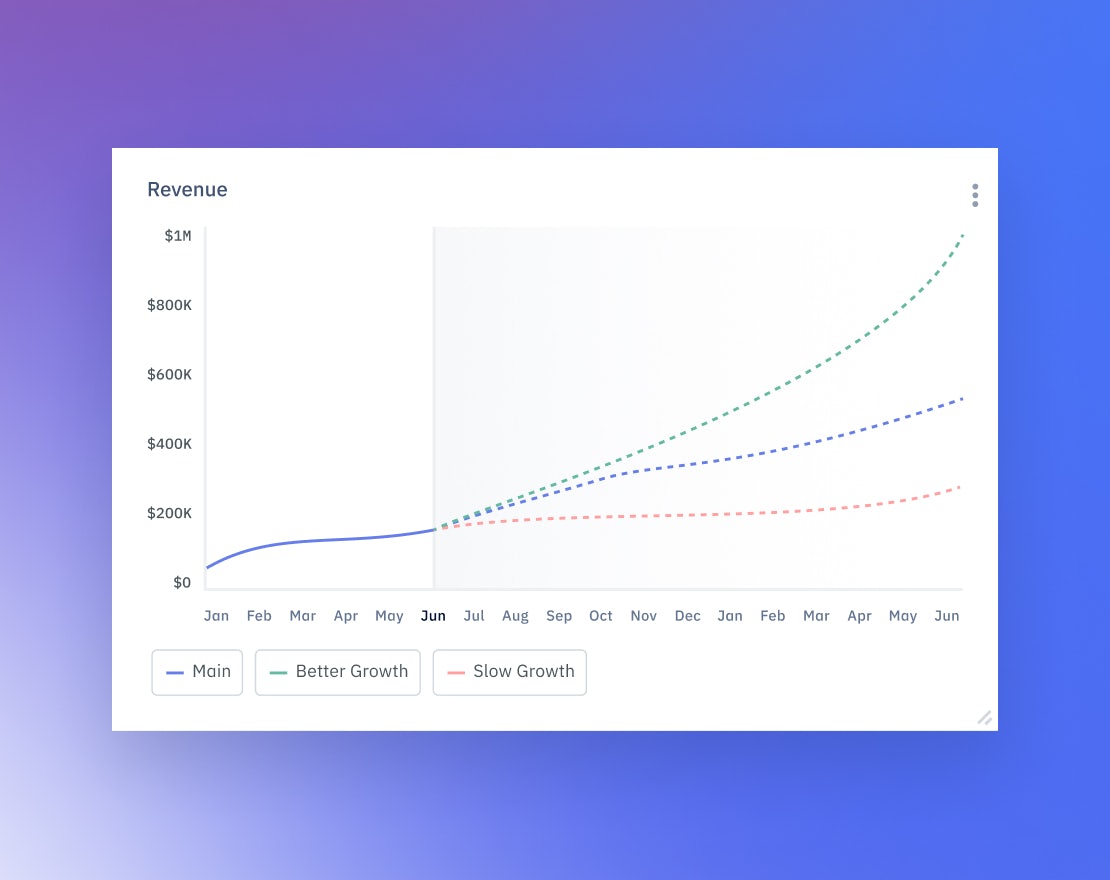
Visually summarize multiple scenarios in one elegant chart.
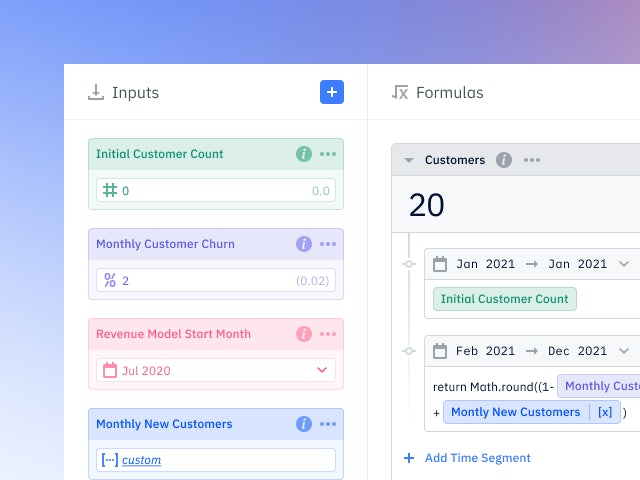
Financial modeling, reporting, and forecasting.
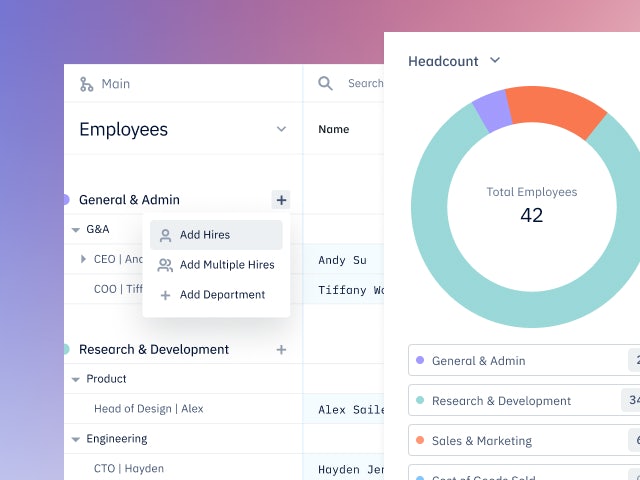
Track your team and plan for new hires.
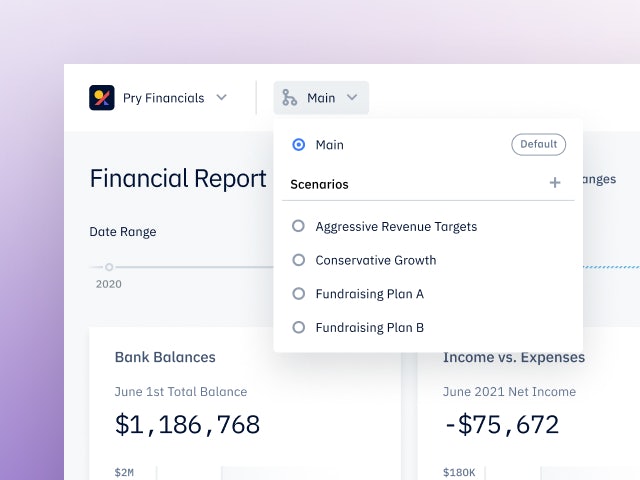
Compare different financial situations.