Overview
The Pry dashboard is interactive and highly customizable. You can build custom charts based off of your Pry data to track and display your KPIs for both financial and non-financial metrics. You can also share your custom dashboard link with your executive team members or investors.
Creating and Managing Dashboards
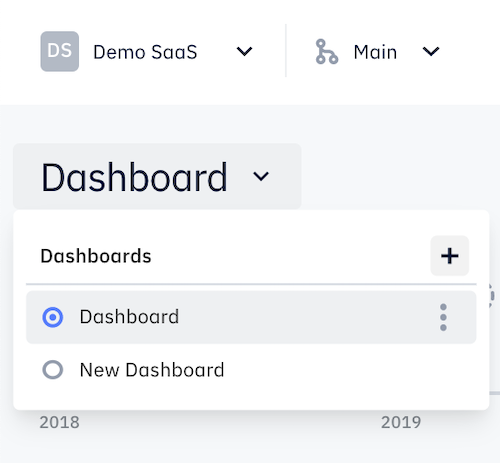
To create a new dashboard, click on the Dashboard drop-down and click on the "+" sign to add a new dashboard.
To switch to another dashboard, click on the Dashboard drop-down and select the dashboard from the list.
Sharing a Dashboard
If you want to share your dashboard, you can choose between inviting an user to your Pry account or creating an external link. See our section about Project Members to learn more about access controls. This section will cover sharing external links to your dashboard.
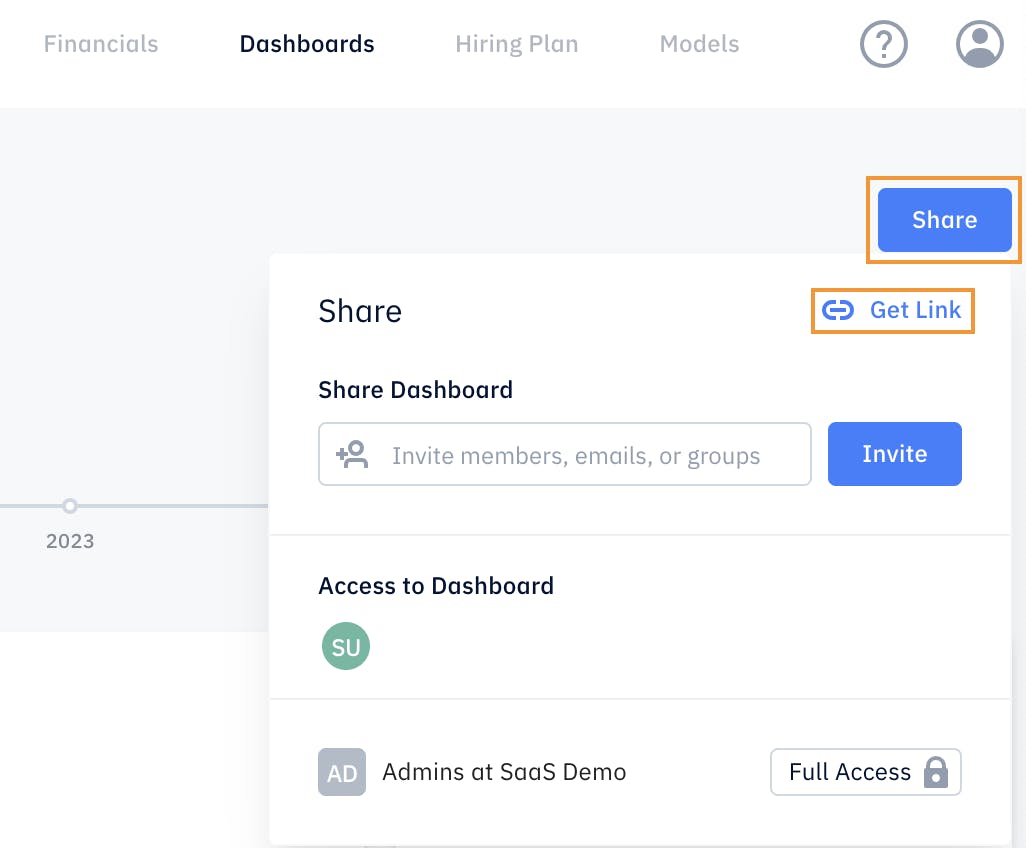
To get started, click on the Share icon on the dashboard page followed by the Get link icon.
A Share Dashboard window will pop up with your dashboard link and Share Link Settings. Each dashboard has its own link and settings. Make sure you are on the dashboard you intend to share before toggling the Shareable Link icon.
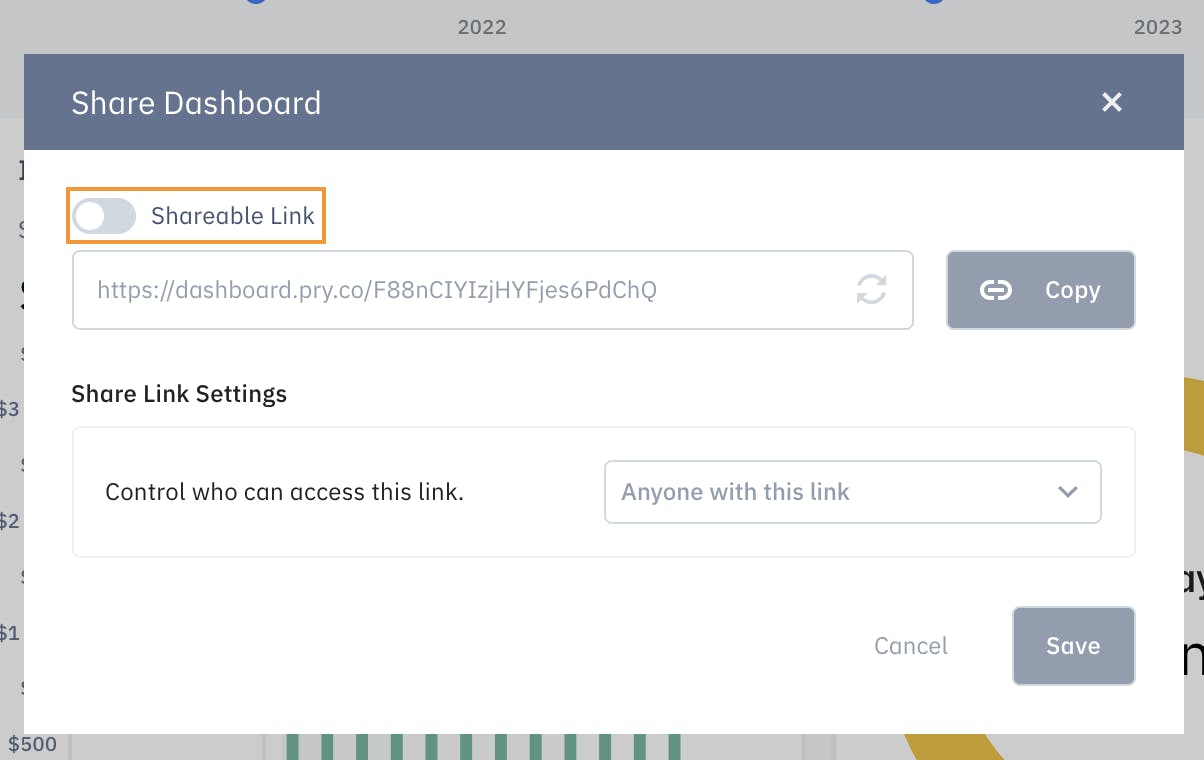
Please note the following when sharing the link:
- By default, everyone with access to the link can access your dashboard after it is turned on.
- You can quickly copy the link by pressing the Copy button next to the link
- The link can be reset with the refresh button next to the link field.
- All date range will be available(it can project beyond the 5-year forecasts).
- You can password protect your dashboard.
To password protect your dashboard, click on the dropdown on the Share Link Settings and select People with password.
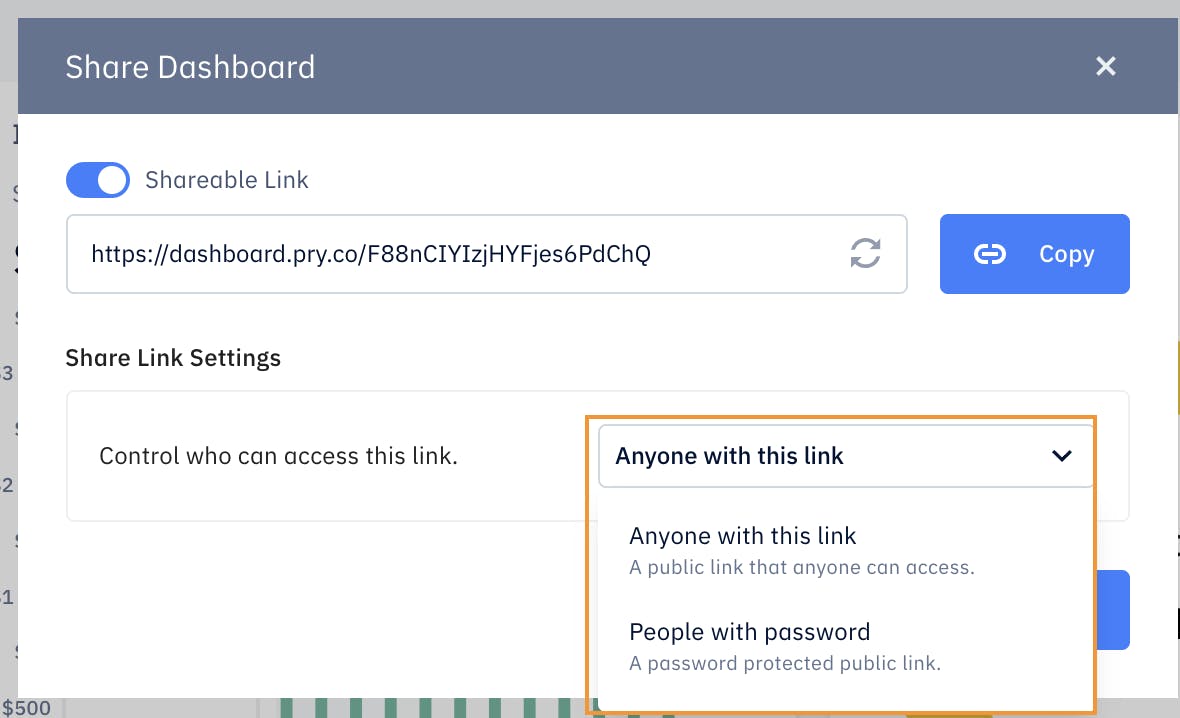
Afterwards, set a password and press Save.

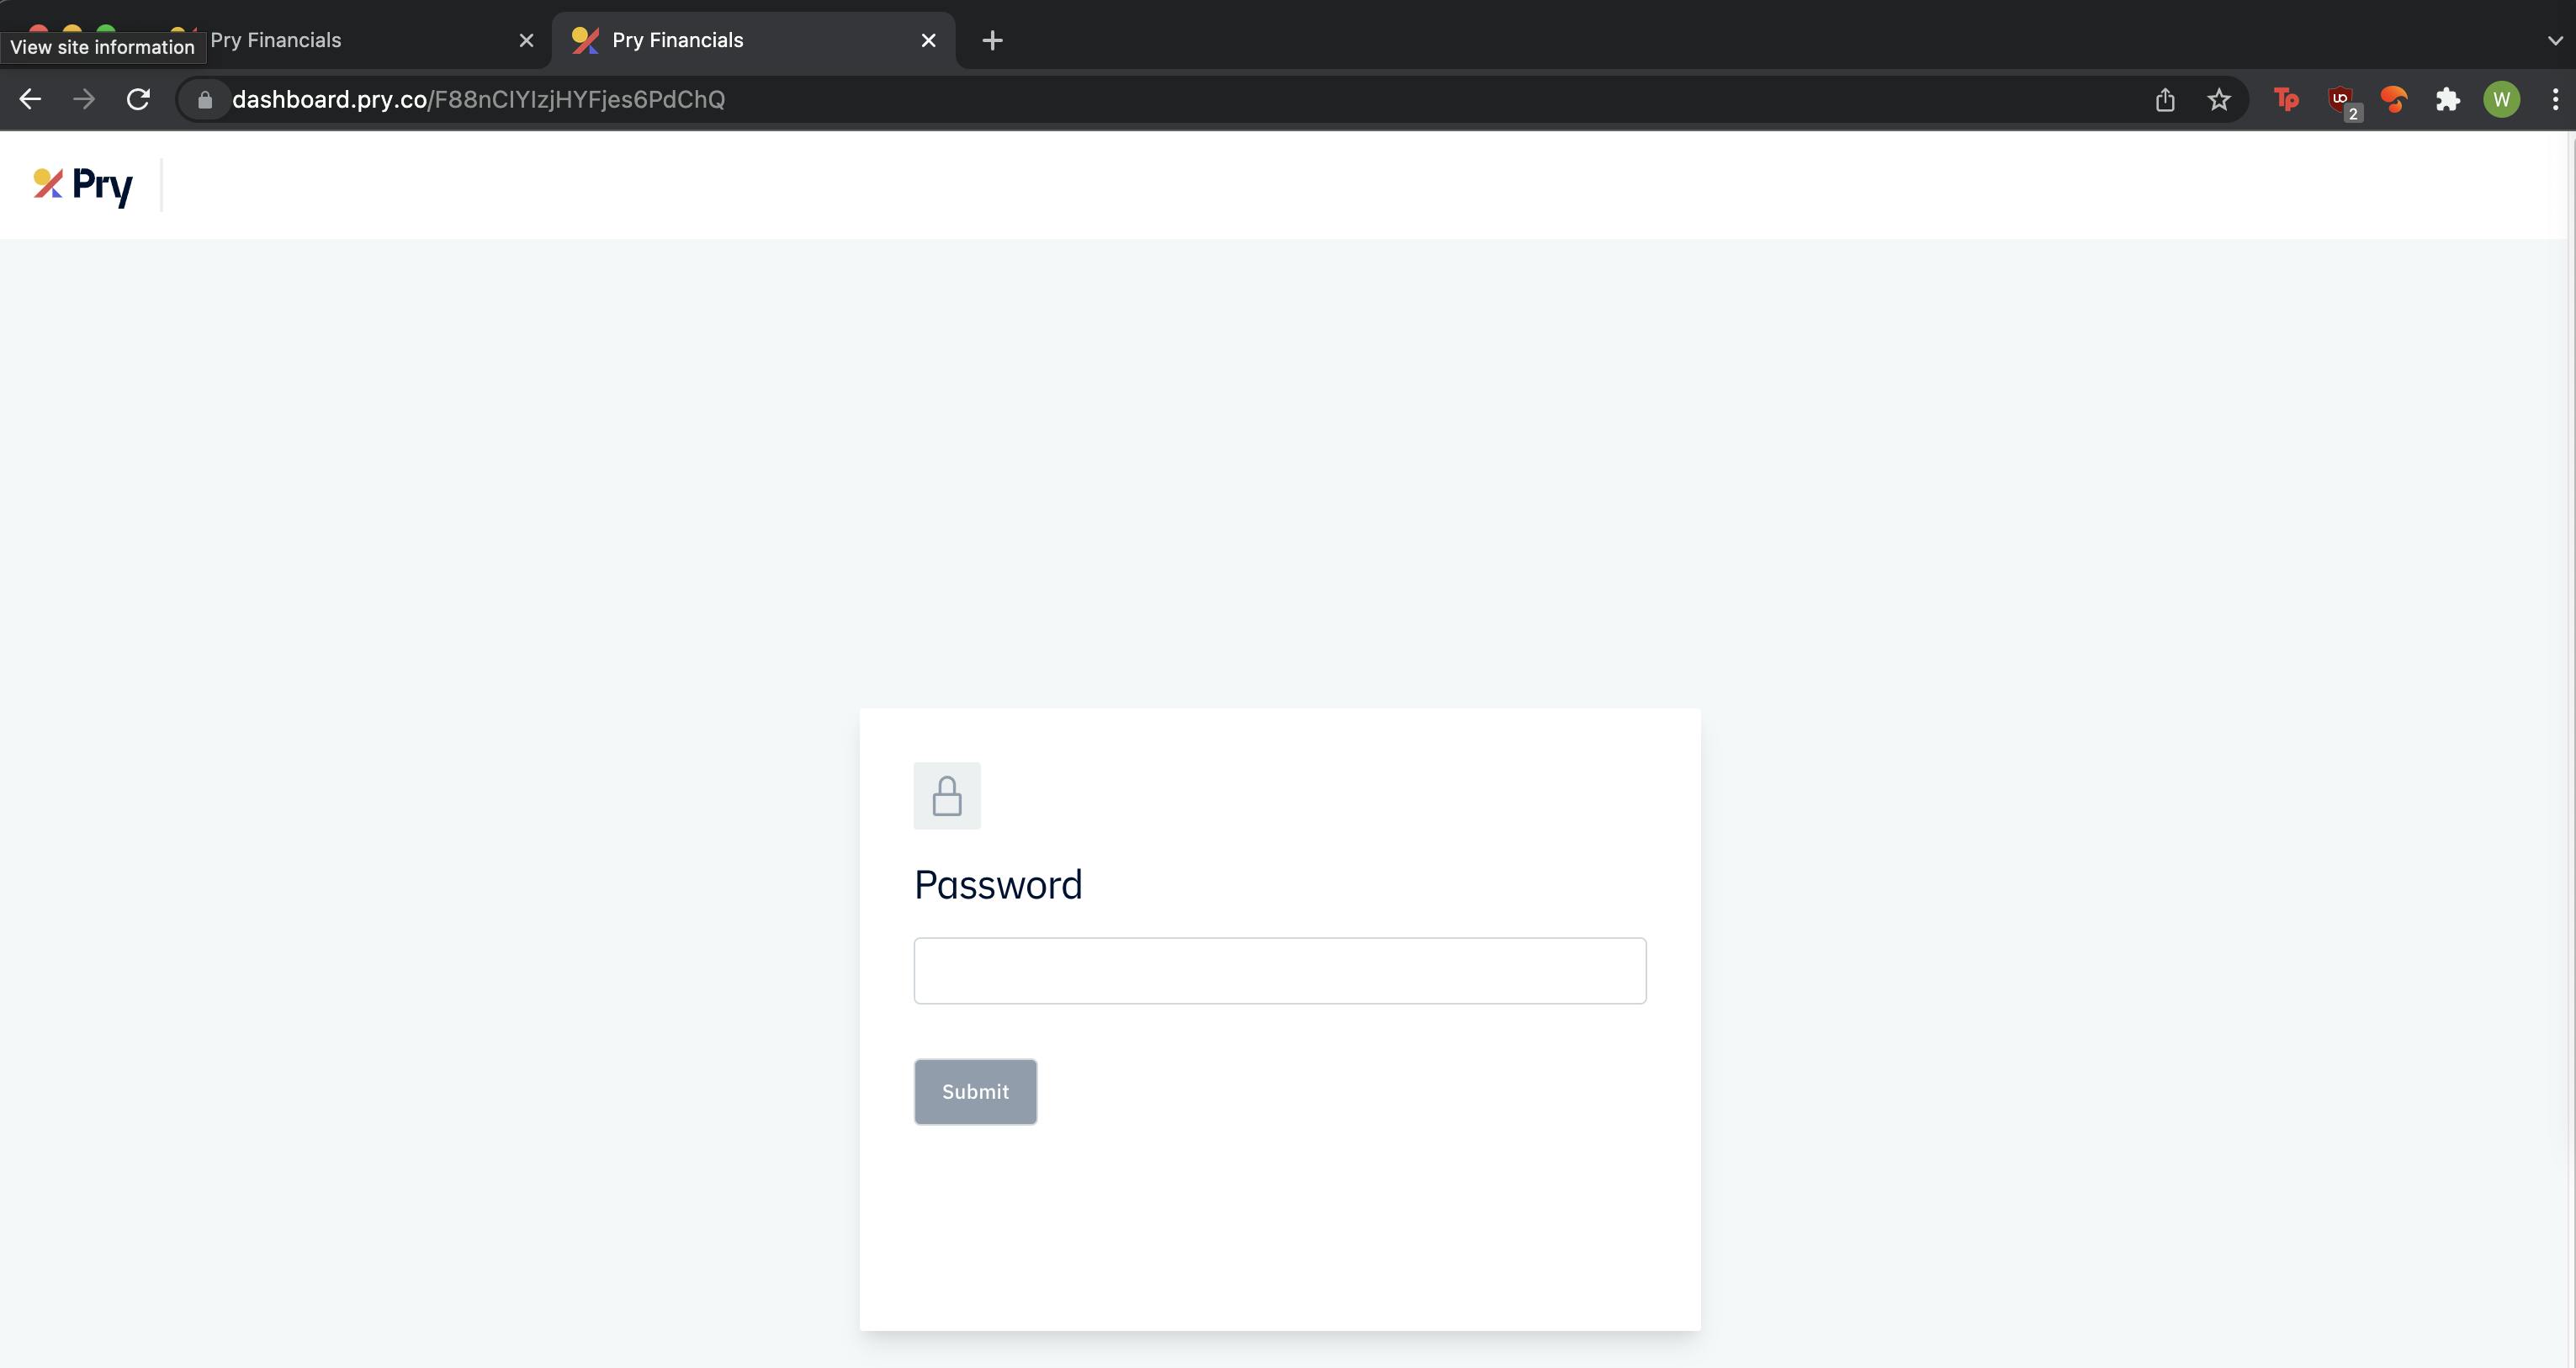
People accessing your dashboard link will be prompted to input a password every time they try to access your dashboard link.
Sections
A dashboard can have multiple sections. Sections have their own dates, scenarios, and date range. You can use multiple sections to compare different financial situations on the same dashboard.
Click on Edit to enter edit view.
To create a section, click on Add Section at the bottom of the dashboard.
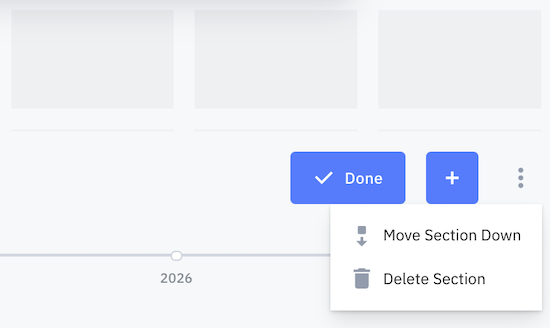
To move or delete the dashboard section, click on the option menu (3 vertical dots) on the section header next to "done" and "+".
Section Name
The Section name can be customized. Click on the name to rename it.
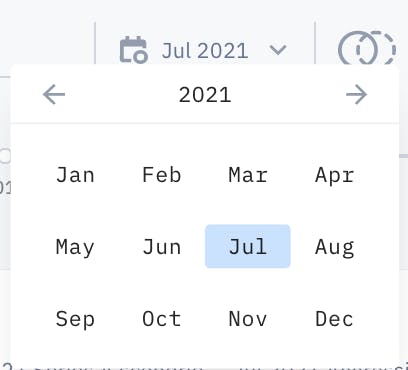
Preview month
The preview month will set the preview for all of the charts within the section. The preview month can be different from section to section and can be set in view or edit mode.
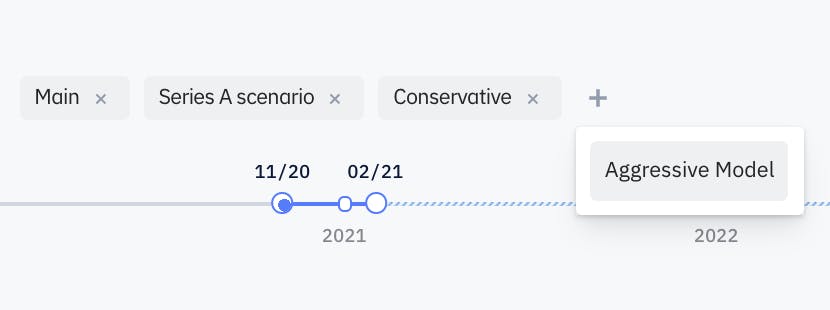
Scenarios
Every Section can reference multiple scenarios. Click the "+" sign to add more scenarios to the section. The charts within the section need to be configured to show data from 'all scenarios' in order to show comparisons.
Date Range
Sections have their own date ranges that are unaffected by other sections.
Once your section is set up, it's time to create charts.
Charts
Each section can have different number and type of charts.
See more info about charts →