Revenue forecasting for founders: how to make projections early
So, you’ve developed a great product and started a company. Congrats!🎉 Now, you may be counting pennies, hoping you can make it beyond next year. And the year after. Unfortunately, about 70% of startup tech companies fail before they complete their second year, and the top reason they fail is that they run out of money. Obviously, you don’t want to join them, so you’re concentrating on trying to predict your company’s future income and cash flow. You need to make some revenue projections...but how do you do that?
TLDR: Revenue forecasting is looking at existing data and predicting how much money your company will bring in from sales in future months, quarters, or years. Even early-stage startups need to track these metrics because accurate and realistic revenue forecasts are the only way you can avoid a big cash flow shortage and complete company meltdown. Investors will want to see your revenue forecast in pitch decks, and you need one internally to build a budget and hiring plan. Here’s how to forecast revenue.
Top-down vs. bottom-up projections
There are two approaches to revenue forecasting:
- Top-down projections (the fast but less accurate way)
- Bottom-up projections (the more accurate way, but historical data is required)
Below, we’ll explain some of the nuances and main differences between top-down and bottom-up projections.
Top-down projections
Early-stage startups usually perform top-down projections because they’re easier and faster—but they don’t show you how to achieve those projections. Top-down projections start with the goals the company must achieve in order to reach profitability.
For example, YC startups are often advised to aim for 15% MoM (month over month) revenue growth. So if your company’s revenue for this month is $100, your top-down revenue projection for next month would be $115. The challenge with this type of projection is that it’s not based on your company’s individual data — just the ballpark industry average — so that 15% may not be realistic for your company.
“While top-down forecasting is viewed as less credible than a bottoms-up forecast, it is still useful for quickly validating the revenue potential of an early-stage company operating in markets that are not yet well-defined." - Wall Street Prep
Bottom-up projections
Bottom-up projections require more assumptions about hiring, months of data about past expenses and revenue, and more time to calculate everything, all of which early startups don’t have. On the other hand, as your company grows, you can assign bottom-up assumptions to different team members. This approach tends to make more accurate projections because subject matter experts are handling the details. For example, HR would handle the assumptions about hiring, a sales leader would tackle quota, and marketing would take on MoM visitor growth. All of these details play into a revenue projection as either an expense or income.
Try Pry’s growth calculator
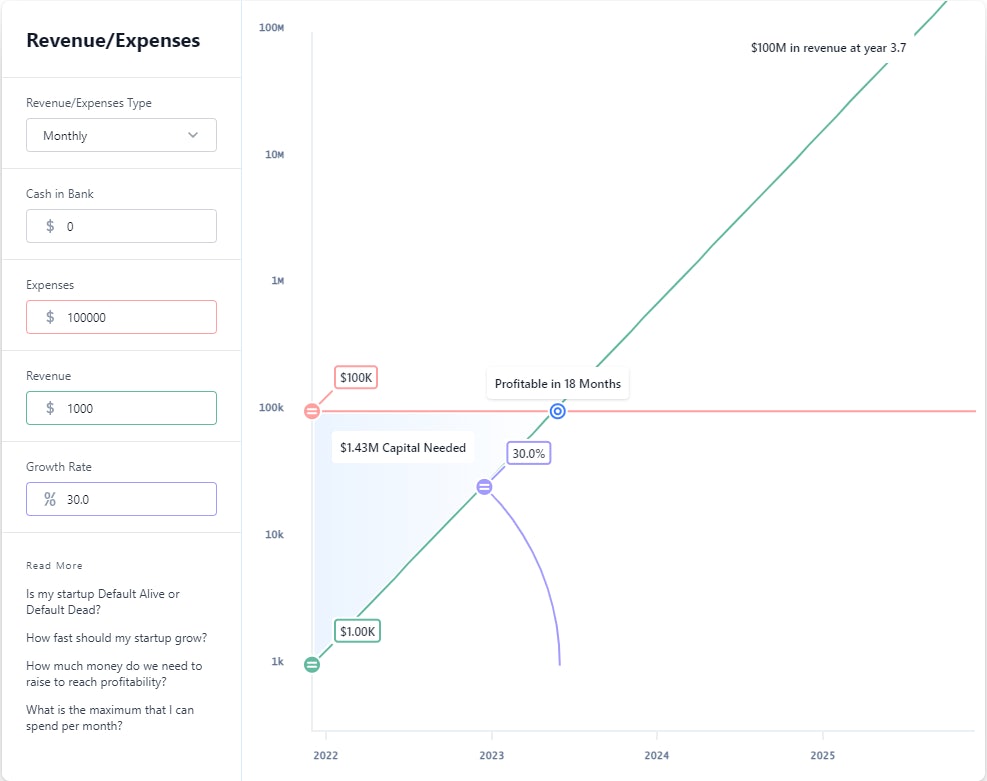
Pry’s startup growth calculator can help you quickly create a growth strategy by answering questions, like “How fast can we afford to grow without running out of money?" You can enter your current cash balance, existing expenses, recurring revenue, and MoM revenue growth rate. Or you can play with the numbers by sliding the handles around until you reach your target revenue.
5 steps to revenue forecasting
There are a few basic steps to creating a realistic revenue forecast: subtract expenses from future revenue, compare the forecast to industry averages, display it visually, and keep it up-to-date. We break it down below.
1. Add up existing expenses
You can’t forecast profit without accounting for your expenses (though plenty of startups have tried). Forecasting expenses will help you make sure you’ll have enough cash in the future. Even if you’re pre-revenue, you can forecast expenses. Start by adding up current fixed costs, like:
- Office rent
- Utility and phone bills
- Legal, insurance, and licensing fees*
- Technology costs (like web hosting fees)
- Marketing costs*
- Salaries
(* Remember to overestimate marketing and legal expenses.)
Once you add up all your expenses, subtract them from your gross revenue forecast to make up your net revenue forecast. We’ll explain how to do that below. You’ll also be able to plug your expenses into Pry’s startup growth calculator. If you’re not spending very much, you may not need nearly as much capital as you previously thought. Or if you’re spending way too much, you’ll be able to see that your business is not going to work (aka, default dead).
2. Forecast future revenue
Once you’ve accounted for expenses, you can forecast your total revenue. You can build some assumptions about the future based on what’s happening now. Assumptions can take some time to build, depending on the complexity of your business.
Here’s an example: if you’re currently selling 10 widgets per month at $10 per widget, and you expect to do that for the next six months, you can forecast that your revenue will be $600 by the end of those six months (10 widget x $10 x 6 months=$600 revenue).
But keep in mind that your revenue formula will depend on your business and industry.
- A product sales company’s revenue = (number of units sold x average price x number of purchases) - total projected expenses
- A service company’s revenue = (number of customers x average price x number of purchases) - total projected expenses
To do this calculation, you first need to determine how sales are calculated in your industry (e.g., billable hours or per square foot). Next, figure out how often your customers will buy from you. For example, SaaS companies can count on monthly billing, but tax preparation companies have a busy season that happens once a year. There are several different revenue forecasting methods, so it can get even more complex.
You can copy and paste your revenue formulas in Excel:
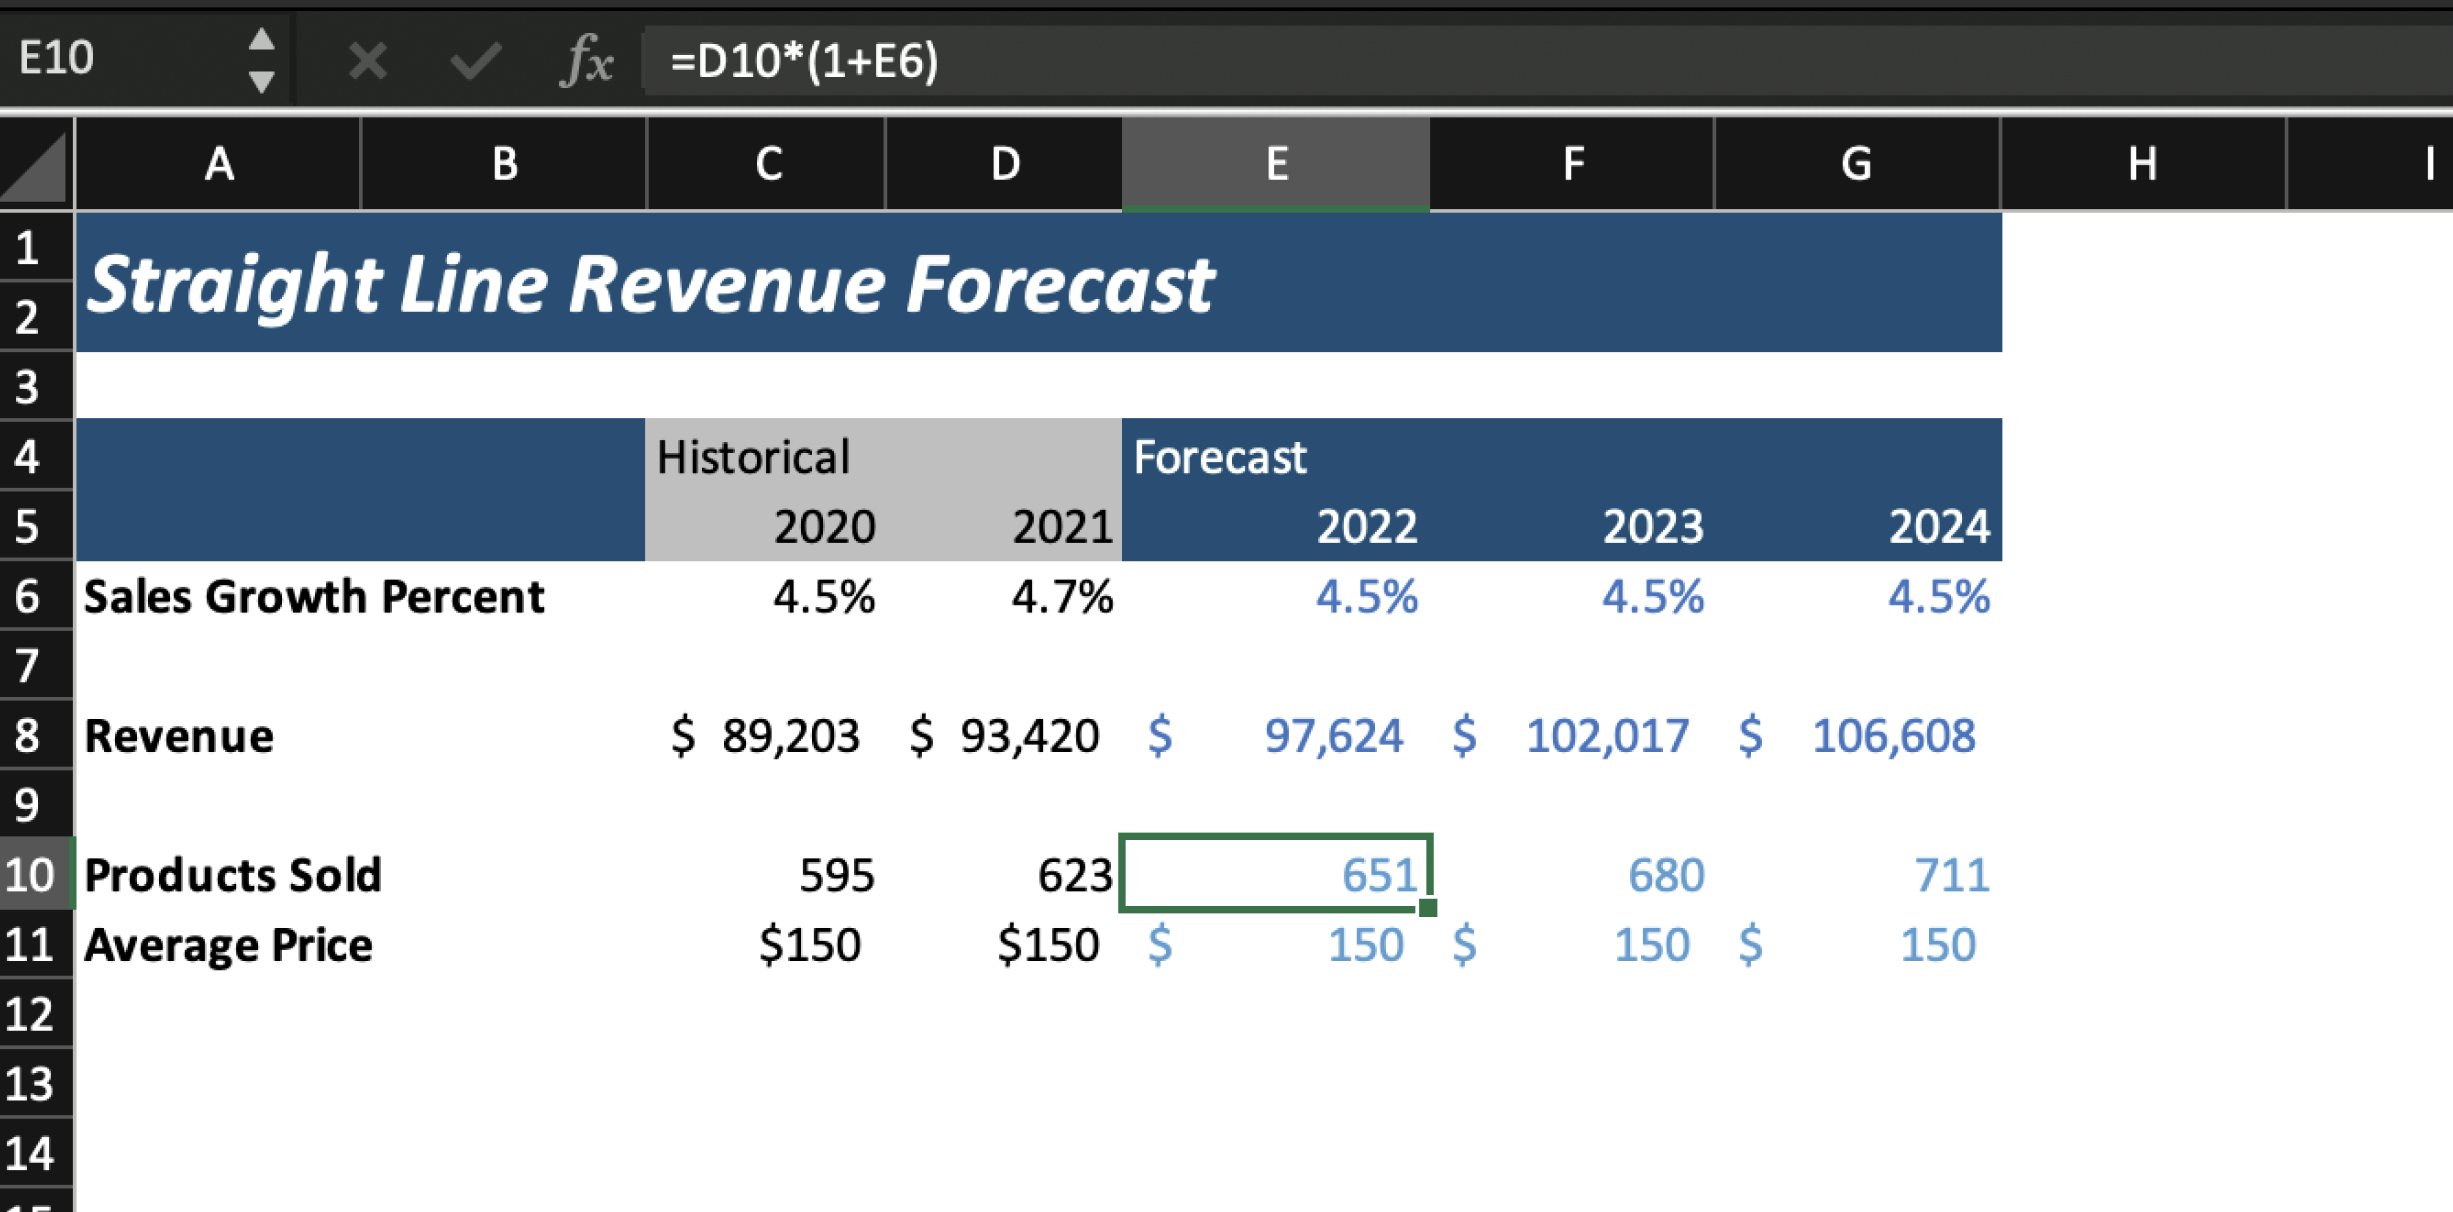
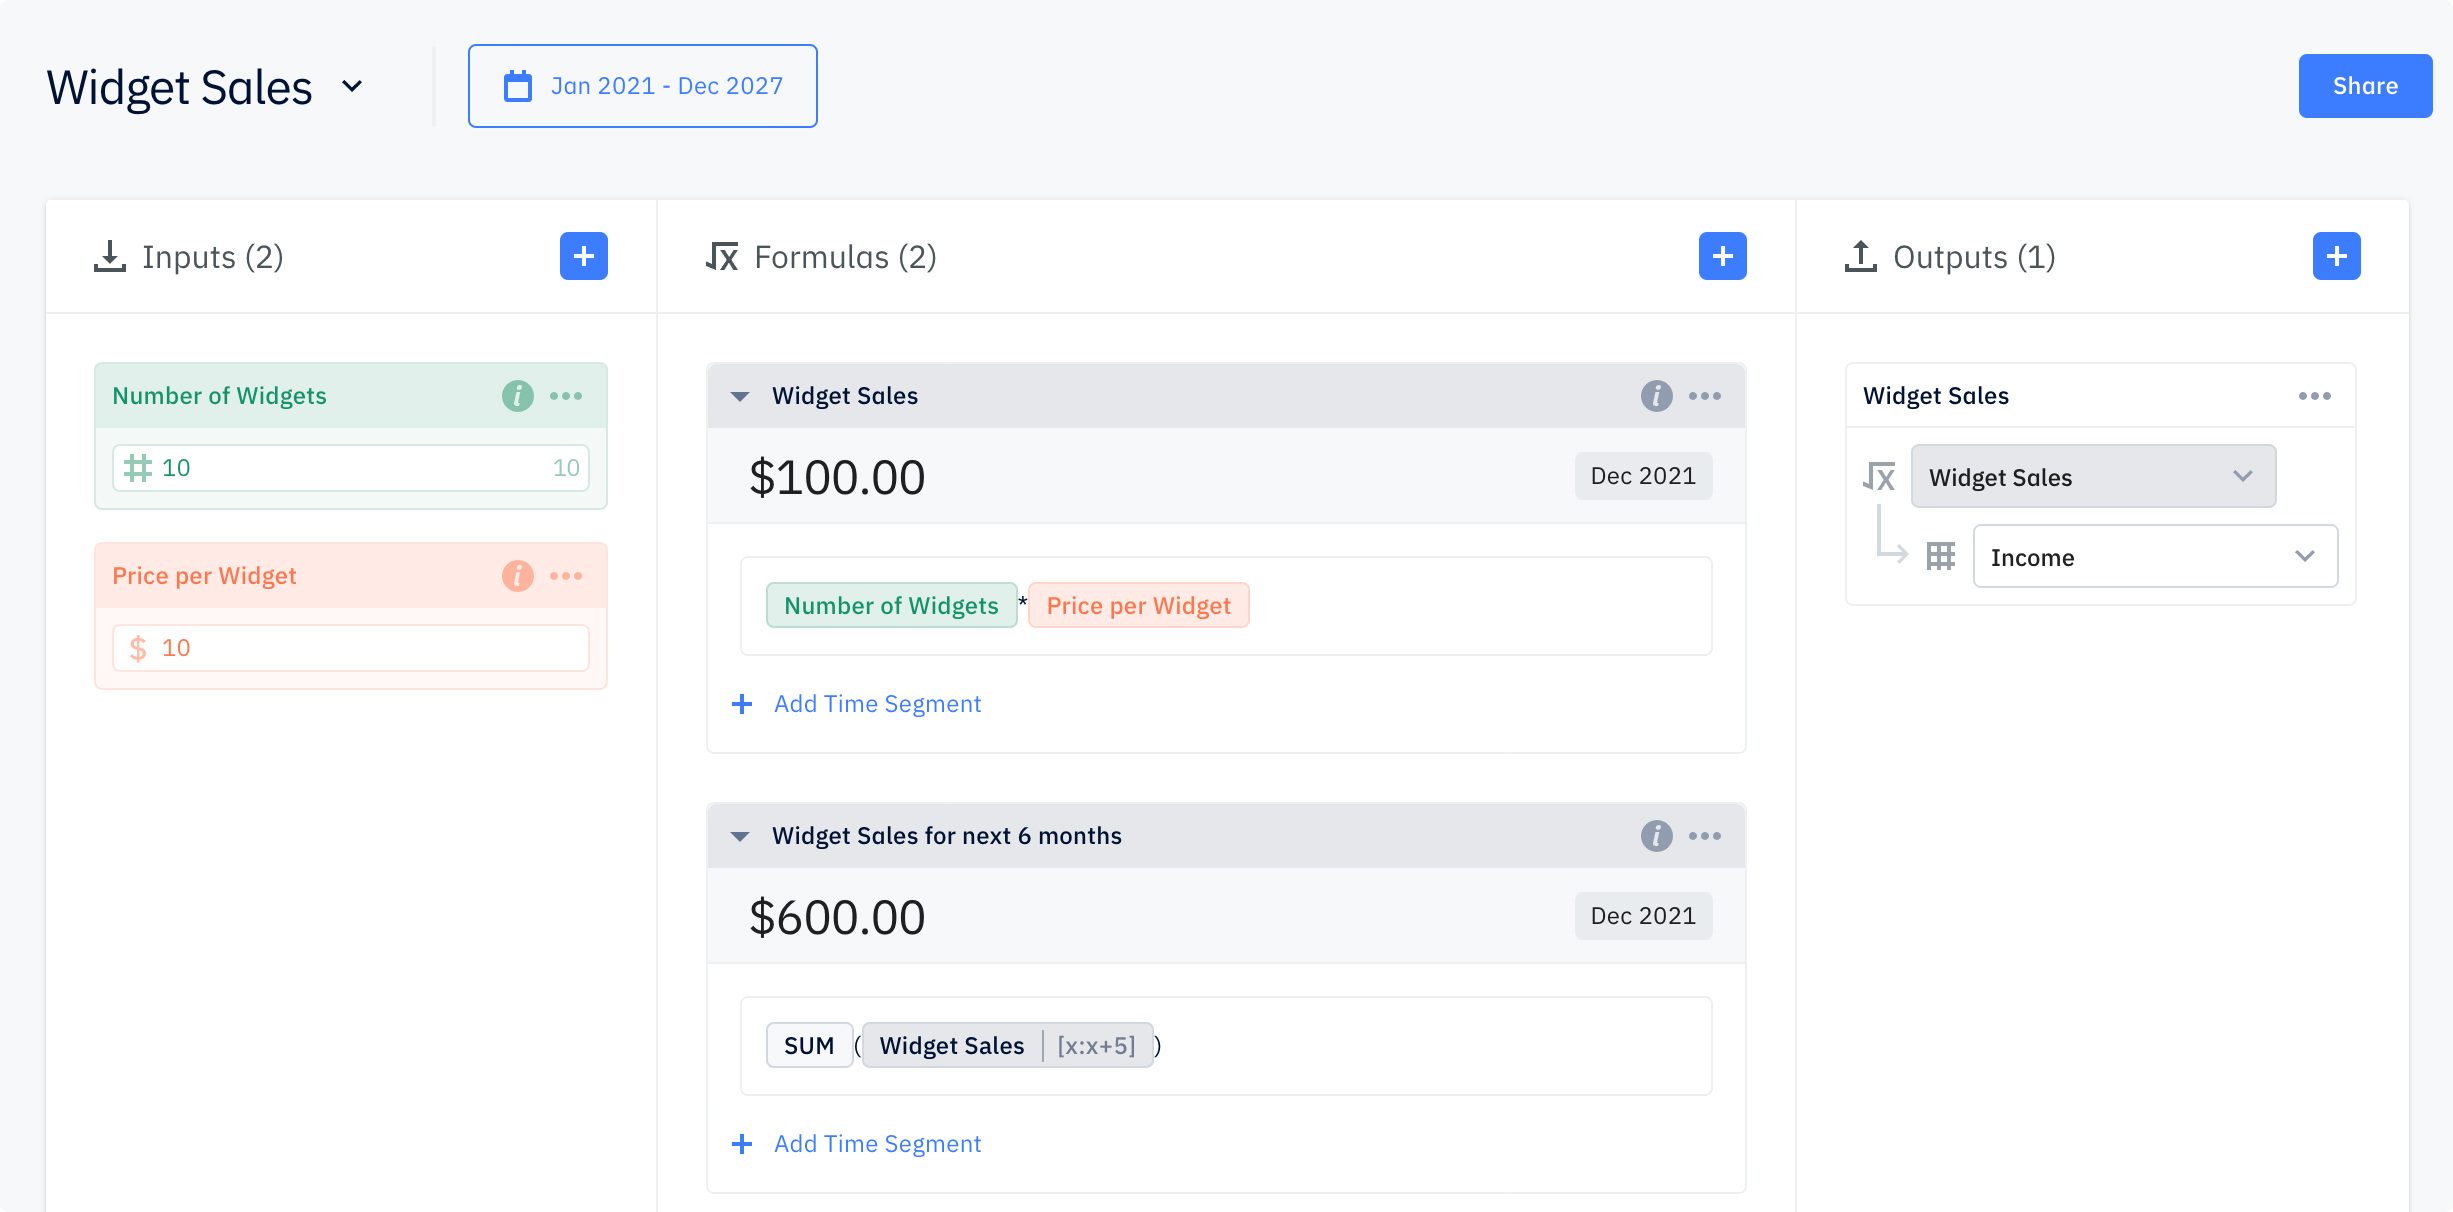
Building the assumptions for a bottom-up revenue forecast can be intricate and time-consuming, so many founders opt for the top-down approach. You’ll simply define a long-term target (what you want to happen) and make that your forecast. Then figure out what you need to do to make that forecast come true.
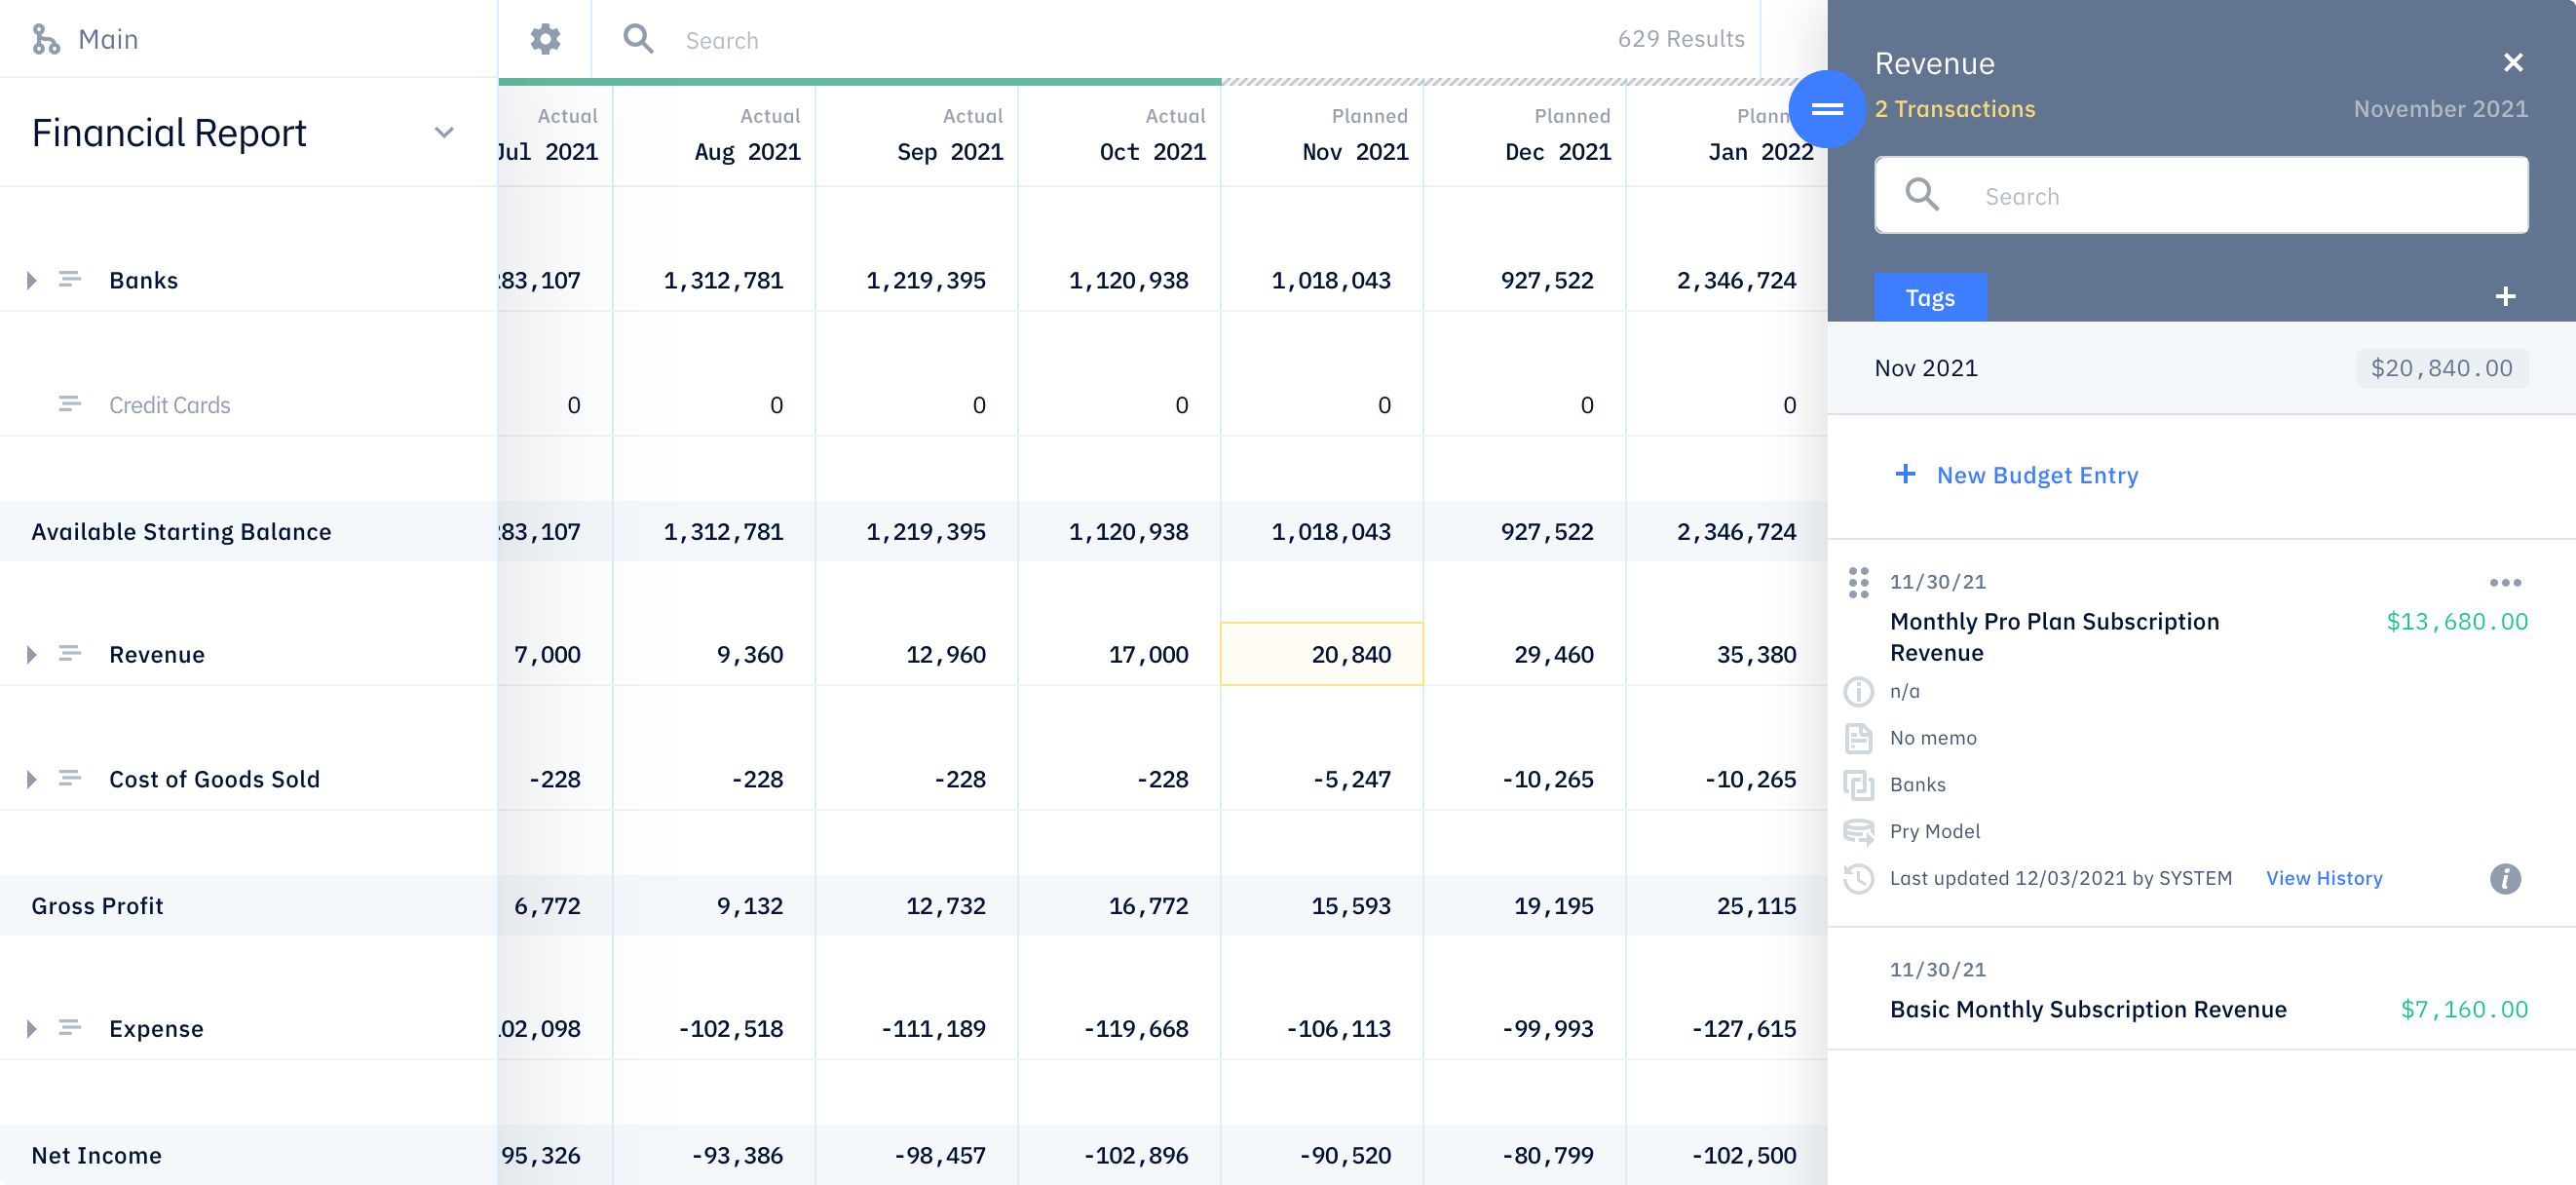
New Pry accounts are automatically created with a simple top down projection.
3. Compare projections with industry averages
No matter which projection approach you use, remember to stay grounded in reality. Hyped-up revenue forecasts may scare off investors and cause you to make risky decisions that sink your company. To make sure your forecast is within a reasonable ballpark, you should check it against the industry to make sure it’s realistic. Cross-reference your projection with other startups’ average revenue by industry, size, market share, stage, fundraising round, and location.
To reference similar business models at the Series A stage, check Y Combinator’s benchmarks for high-growth companies. For example, a B2B SaaS company should aim for over 300% YoY growth, while a consumer company should aim for over 20% MoM.
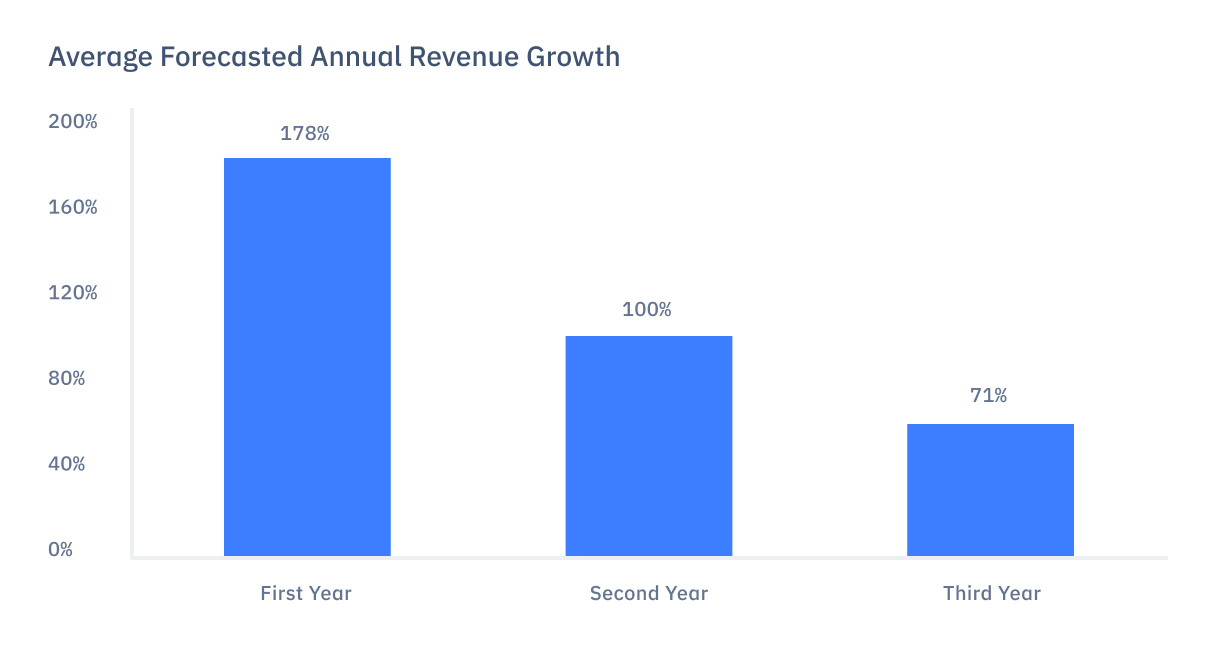
You can also compare your annual revenue growth forecast to yearly global averages reported by Equidam, then convert to a monthly average:
- 178% in year one, or 8.9% MoM
- 100% in year two, or 6% MoM
- 71% in year three, or 4.6% MoM
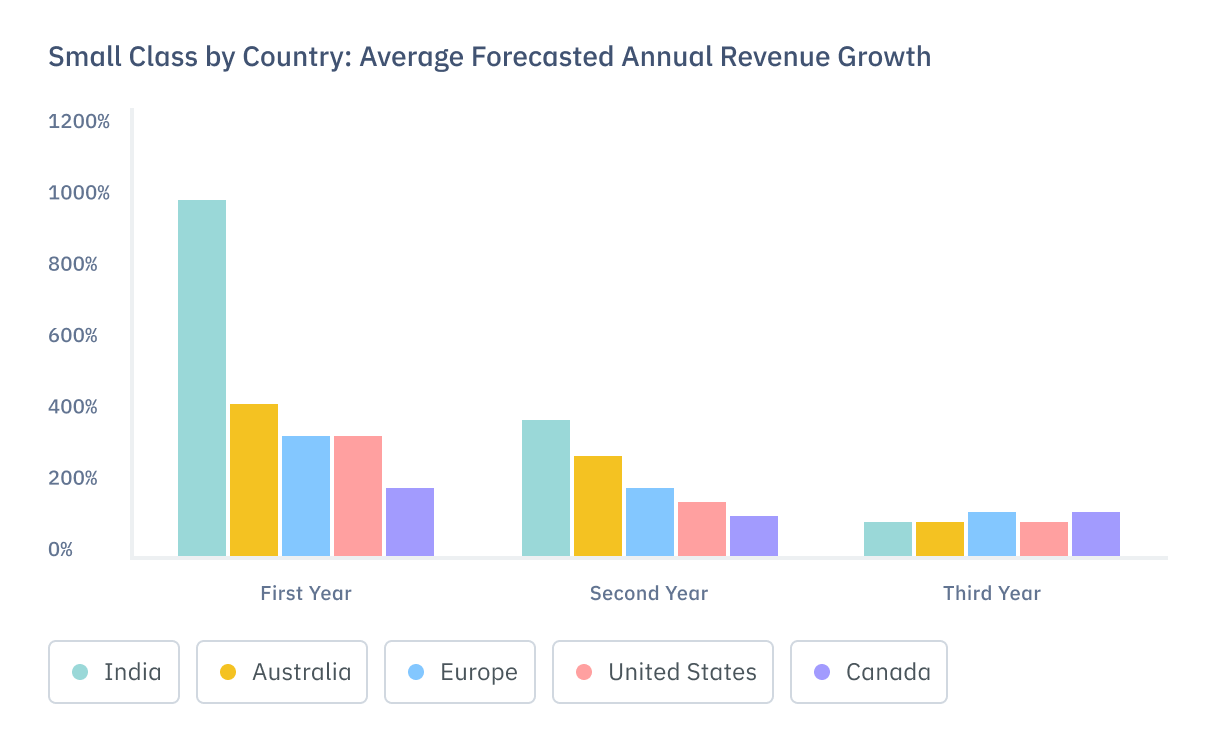
Keep in mind that averages can vary wildly by size and location. For example, smaller companies with $50,000-$250,000 in annual revenue typically forecast a higher growth rate than larger companies. And companies in India forecast a much higher growth rate in their first year (970%) compared with Australian companies (400%).
If you’re building some assumptions about future revenue (bottom-up approach) and need to pull some realistic sales forecasts, you can do some research on the Bureau of Labor Statistics website. Look at industry average sales numbers in the Consumer Expenditures report, go to the Industry at a Glance page, or look at the Producer Price Indexes.
“If you aren’t realistic with your projections, no one will take you seriously. Yet, you also need to show enough revenue and growth to be exciting to potential investors.” - Alejandro Cremades, Panthera Advisors Co-founder
4. Create a visual
Rather than looking at row after row of data, you should create some meaning from your revenue forecast by representing it visually. Visualizing your growth path will help you (and your investors) understand your revenue trajectory at a glance.
If you create your revenue forecast in Excel, you can create a trendline to display the data.
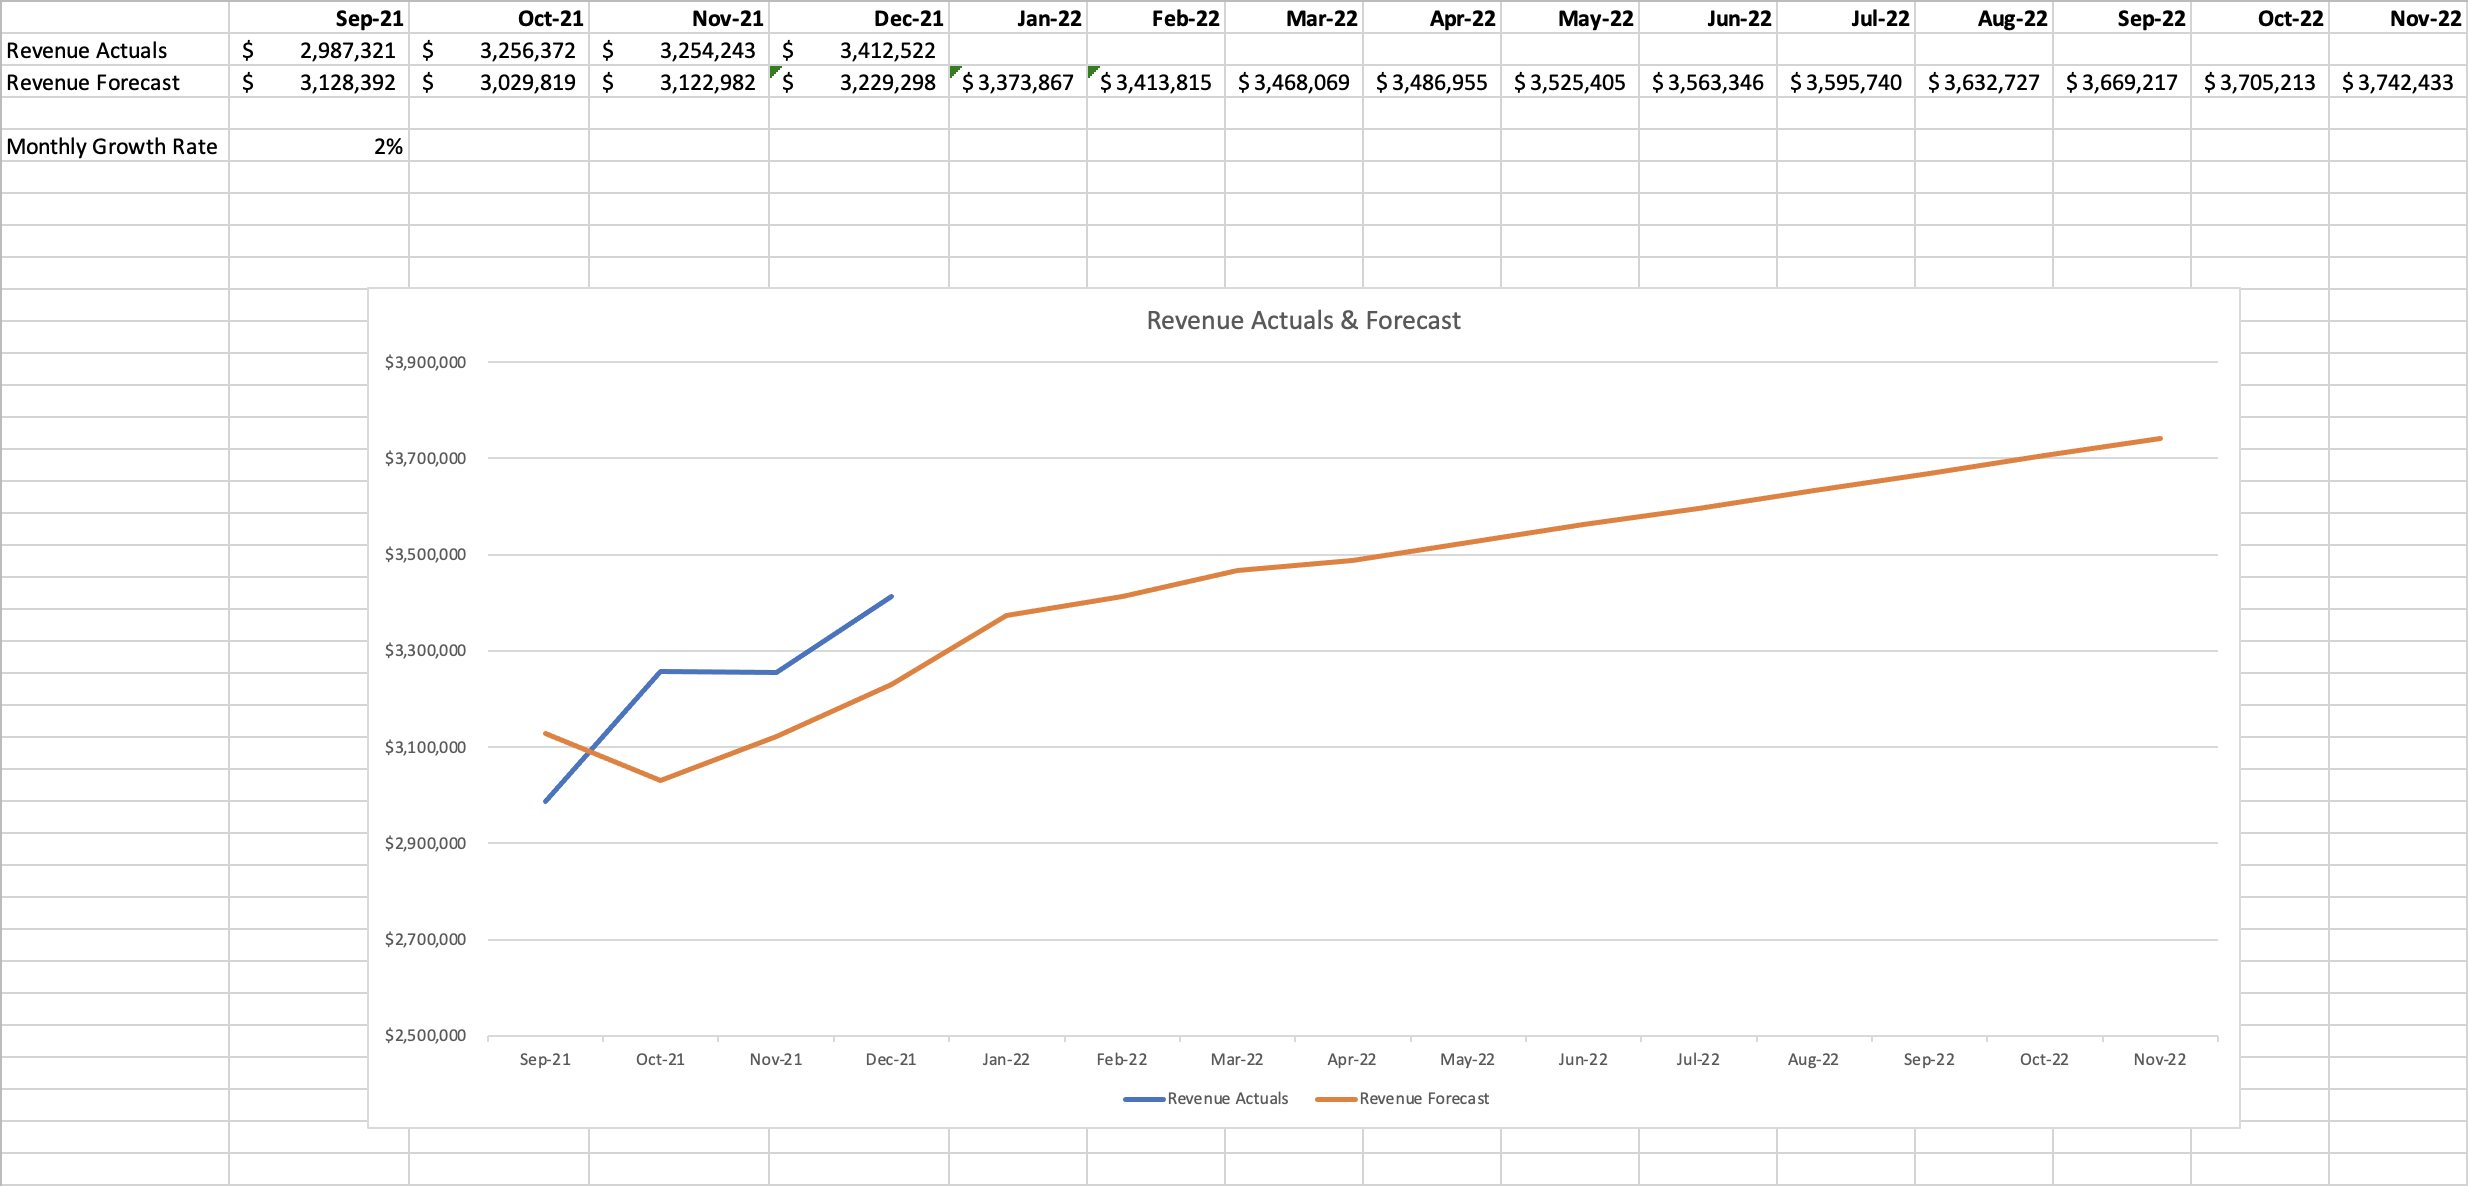
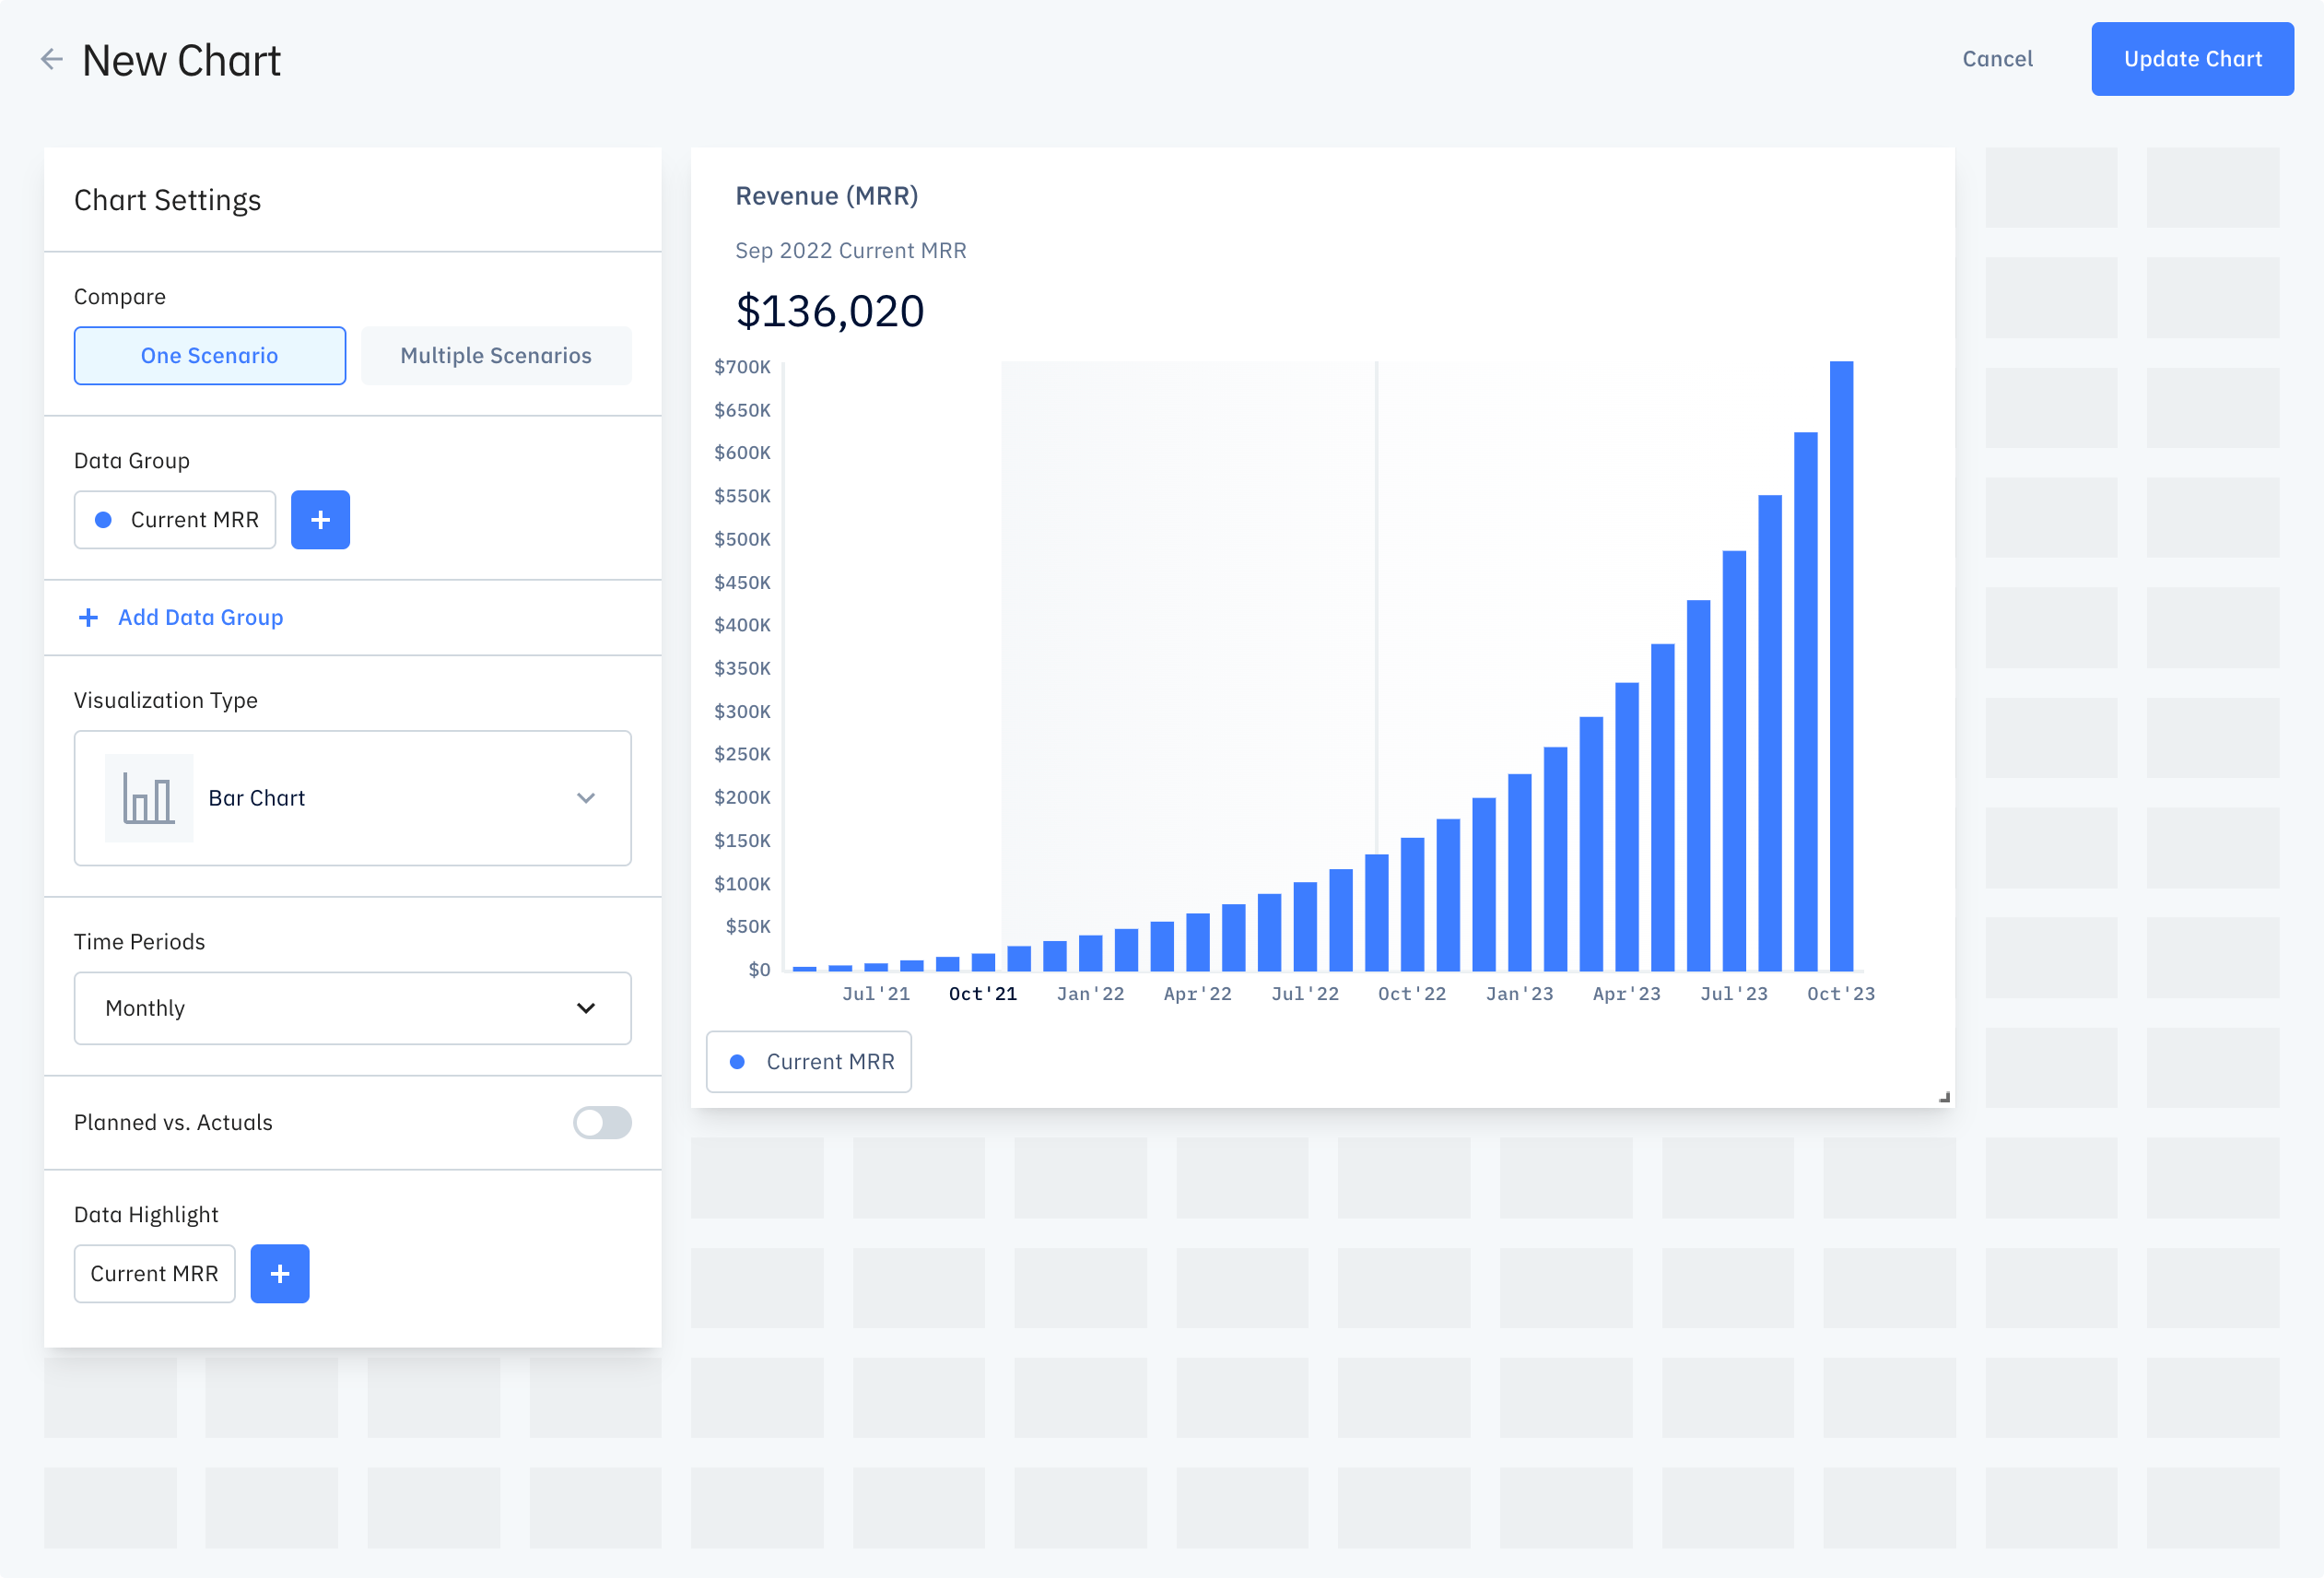
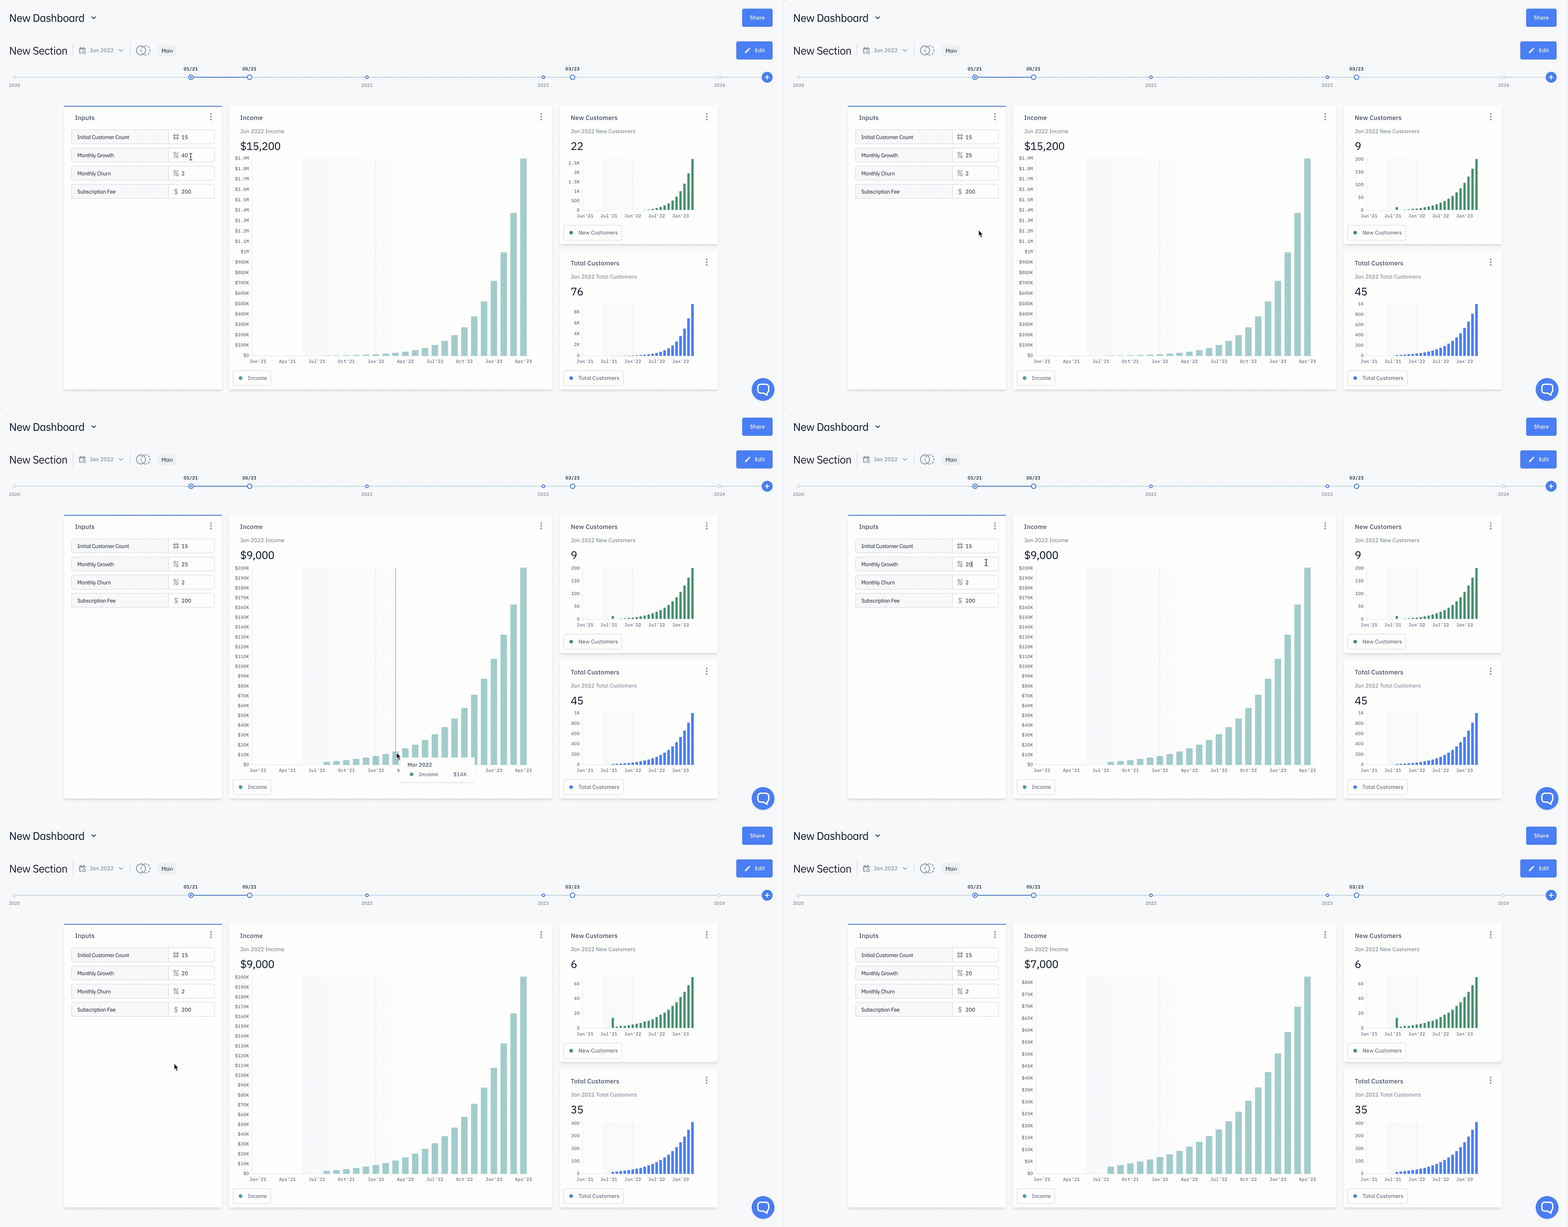
If it’s challenging to troubleshoot Excel formulas and trendlines (or you don’t want to hire an analyst to do it for you), you can try out a financial planning software like Pry. With Pry, you can easily create a bar chart to show your company’s monthly revenue forecast:
5. Update your revenue forecast
Once you have a realistic revenue forecast and it’s displayed visually, the next step is to continually update it based on current data. Do you have new products? Update your forecast with those sales numbers. New hires on the sales team? Update your forecast with those expenses. At a minimum, you should update your revenue forecast monthly. If you hire a CFO, they should update your forecast every two weeks.
“Your revenue forecast is as accurate as how well you update it and maintain it.” — Daniel Diaz, Chief Operating Officer at fst
Software like Pry is very beneficial in keeping your forecasts updated. Banking, payroll, and accounting integrations automatically sync to your financial plan, so all your data — including projections — is constantly up-to-date.
Pry also makes it easy to adjust variables. For example, if you need to quickly update the monthly growth percentage, you can do that by simply updating the monthly growth input variable. That change will flow automatically into your revenue chart on your dashboard.
Get your company’s future in hand with a revenue forecast
Now that you know how to forecast revenue, you can get a better handle on your company’s future income. Then, use that information to adjust pricing and sales so you can meet your profit and growth goals. Next up? Learn how to make other financial projections using Pry’s comprehensive financial planning tool.

.jpg?ixlib=gatsbyFP&auto=compress%2Cformat&fit=max&lossless=true&max-w=1280&q=65)