First what-if analysis? Here's how to create one

So your business is going well...right now. But as a startup founder, you’ve still got a lot of questions about the future. Can you afford to hire more people (and the bigger office space that comes with that)? What if customer churn is higher next month? Or what if you charge $20 per item instead of $15? When will you break even? Most importantly, when will you make a profit?
Unfortunately, no one can know the future with 100% certainty. But you can make some reasonable predictions about your company’s finances using a what-if analysis. This is also called a sensitivity analysis because you’re figuring out how “sensitive” your business is to certain changes.
Creating a what-if analysis is crucial to good decision-making because it allows you to see the outcome of any given scenario when you change certain variables. It exposes which factors might put your company at risk, so you know where to put your focus. It also fosters investors’ trust because it proves out the ROI of their investment. You should perform a what-if analysis before making any major decision. Here’s how to perform one.
- Pick your tool: Spreadsheet or software
- Determine the most important variables for your business’ success
- Construct a data table
- Input values
- Save the original before making any changes to variables
- Add a range of possible scenarios
- Best-case scenario (example)
- Worst-case scenario (example)
- Manage uncertainties with a what-if analysis
Pick your tool: Spreadsheet or software
There are several tools you can choose to perform a what-if analysis. You can plug data into a traditional spreadsheet like Google Sheets or Microsoft Excel, or you can use software like Pry, Causal, or Brixx (obviously, we’re partial to Pry).
Spreadsheets are challenging, even for accounting and finance pros, because they require fluency with formulas, multiple worksheets within a workbook, and pivot tables to display the possible results.
“Even experienced accountants and finance experts will struggle to make changes as minimal – yet influential – as 10 percent sales increases in particular divisions, or a 3 percent decline in another. The use of spreadsheets isn’t just impractical; it is error-prone.” — eCapital Advisors
In contrast, software makes it easier to run a bunch of what-if scenarios with a wide range of constantly changing variables.
“These technologies rely on cloud storage of huge stocks of data to perform predictions in no time. This diminishes the need for bookkeeping and forecasting expertise while maximizing the resulting accuracy and scope of garnered information.”— eCapital Advisors
Determine the most important variables for your business’ success
Before getting into any calculations, you need to identify which variables will impact your business in the future. In the finance industry, a dependent variable (or output) is a thing that will change as a result of something else changing. The “something else” is the independent variable (or input). For example, profit is a dependent variable, and values like office rent or the price of our product are independent variables that affect a business’s profitability.
Some variables are more important than others, depending on your business model. For example, monthly recurring revenue (MRR) is one variable that matters, especially to SaaS founders. You should also think about who you’ll show this to. Daniel Diaz, COO at fst, suggests that bankers may want to see your cash burn rate, a strong balance sheet, and any liabilities. On the other hand, an investor will care more about profit and ROI.
Each scenario you create should answer a question about what might happen to a if b occurs and to what degree each change to b will impact a. Here are some questions you could ask that a sensitivity analysis will help answer:
- If we grow 10% month over month, when will we reach $1m ARR?
- If we increase our pricing, how many customers do we need to hit our goals? Is it realistic to acquire that many customers and convince them of our new pricing?
- If you hire another engineer, salary expenses will go up, do we still have enough runway? How about 2 or 3 more engineers?
- How long will it take to turn a profit?
- If we raised more capital, how would we spend it to grow faster?
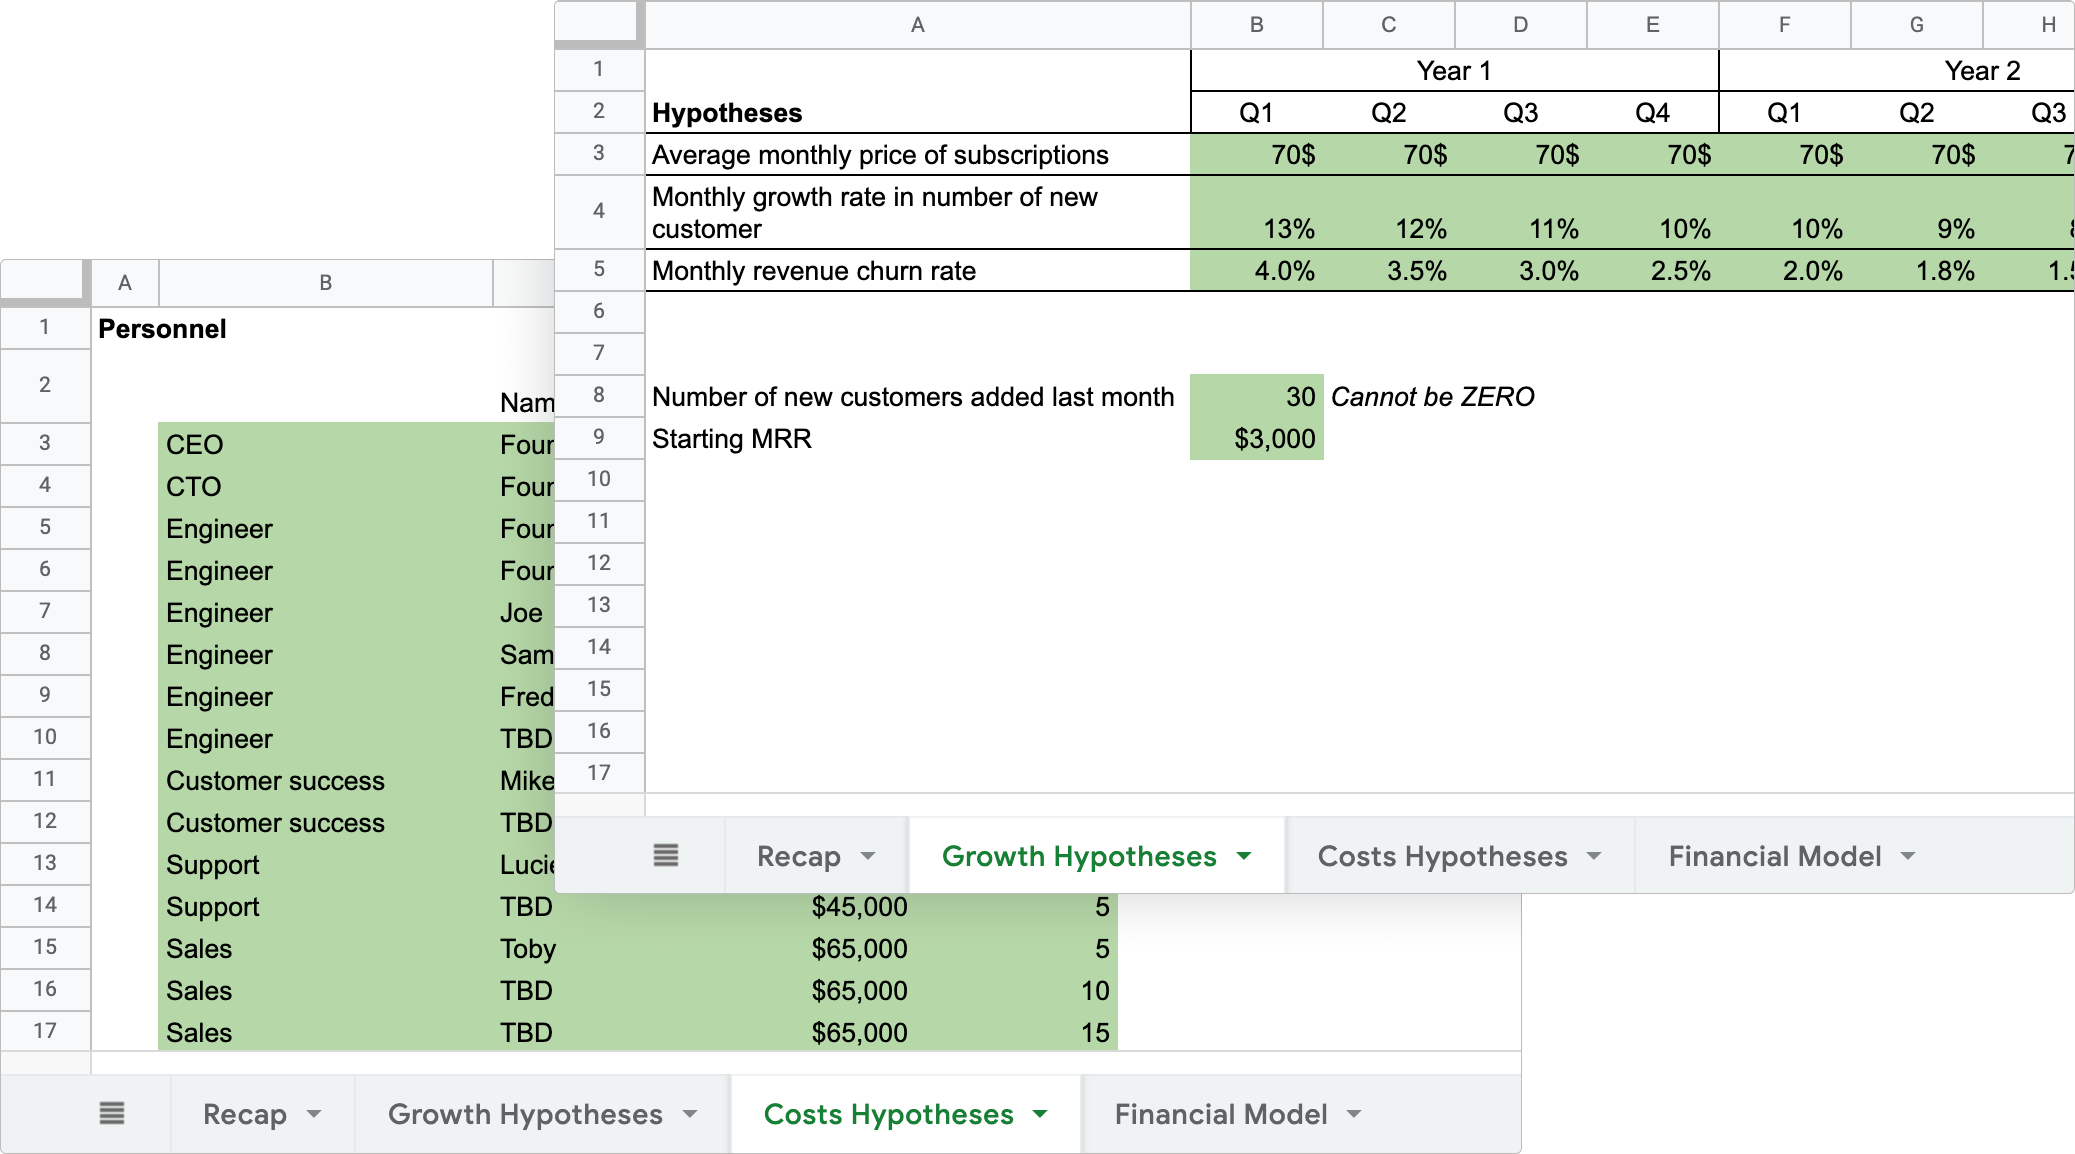
If you prefer to use a spreadsheet, you could download an online template like this one that includes a model based on growth and one based on costs.
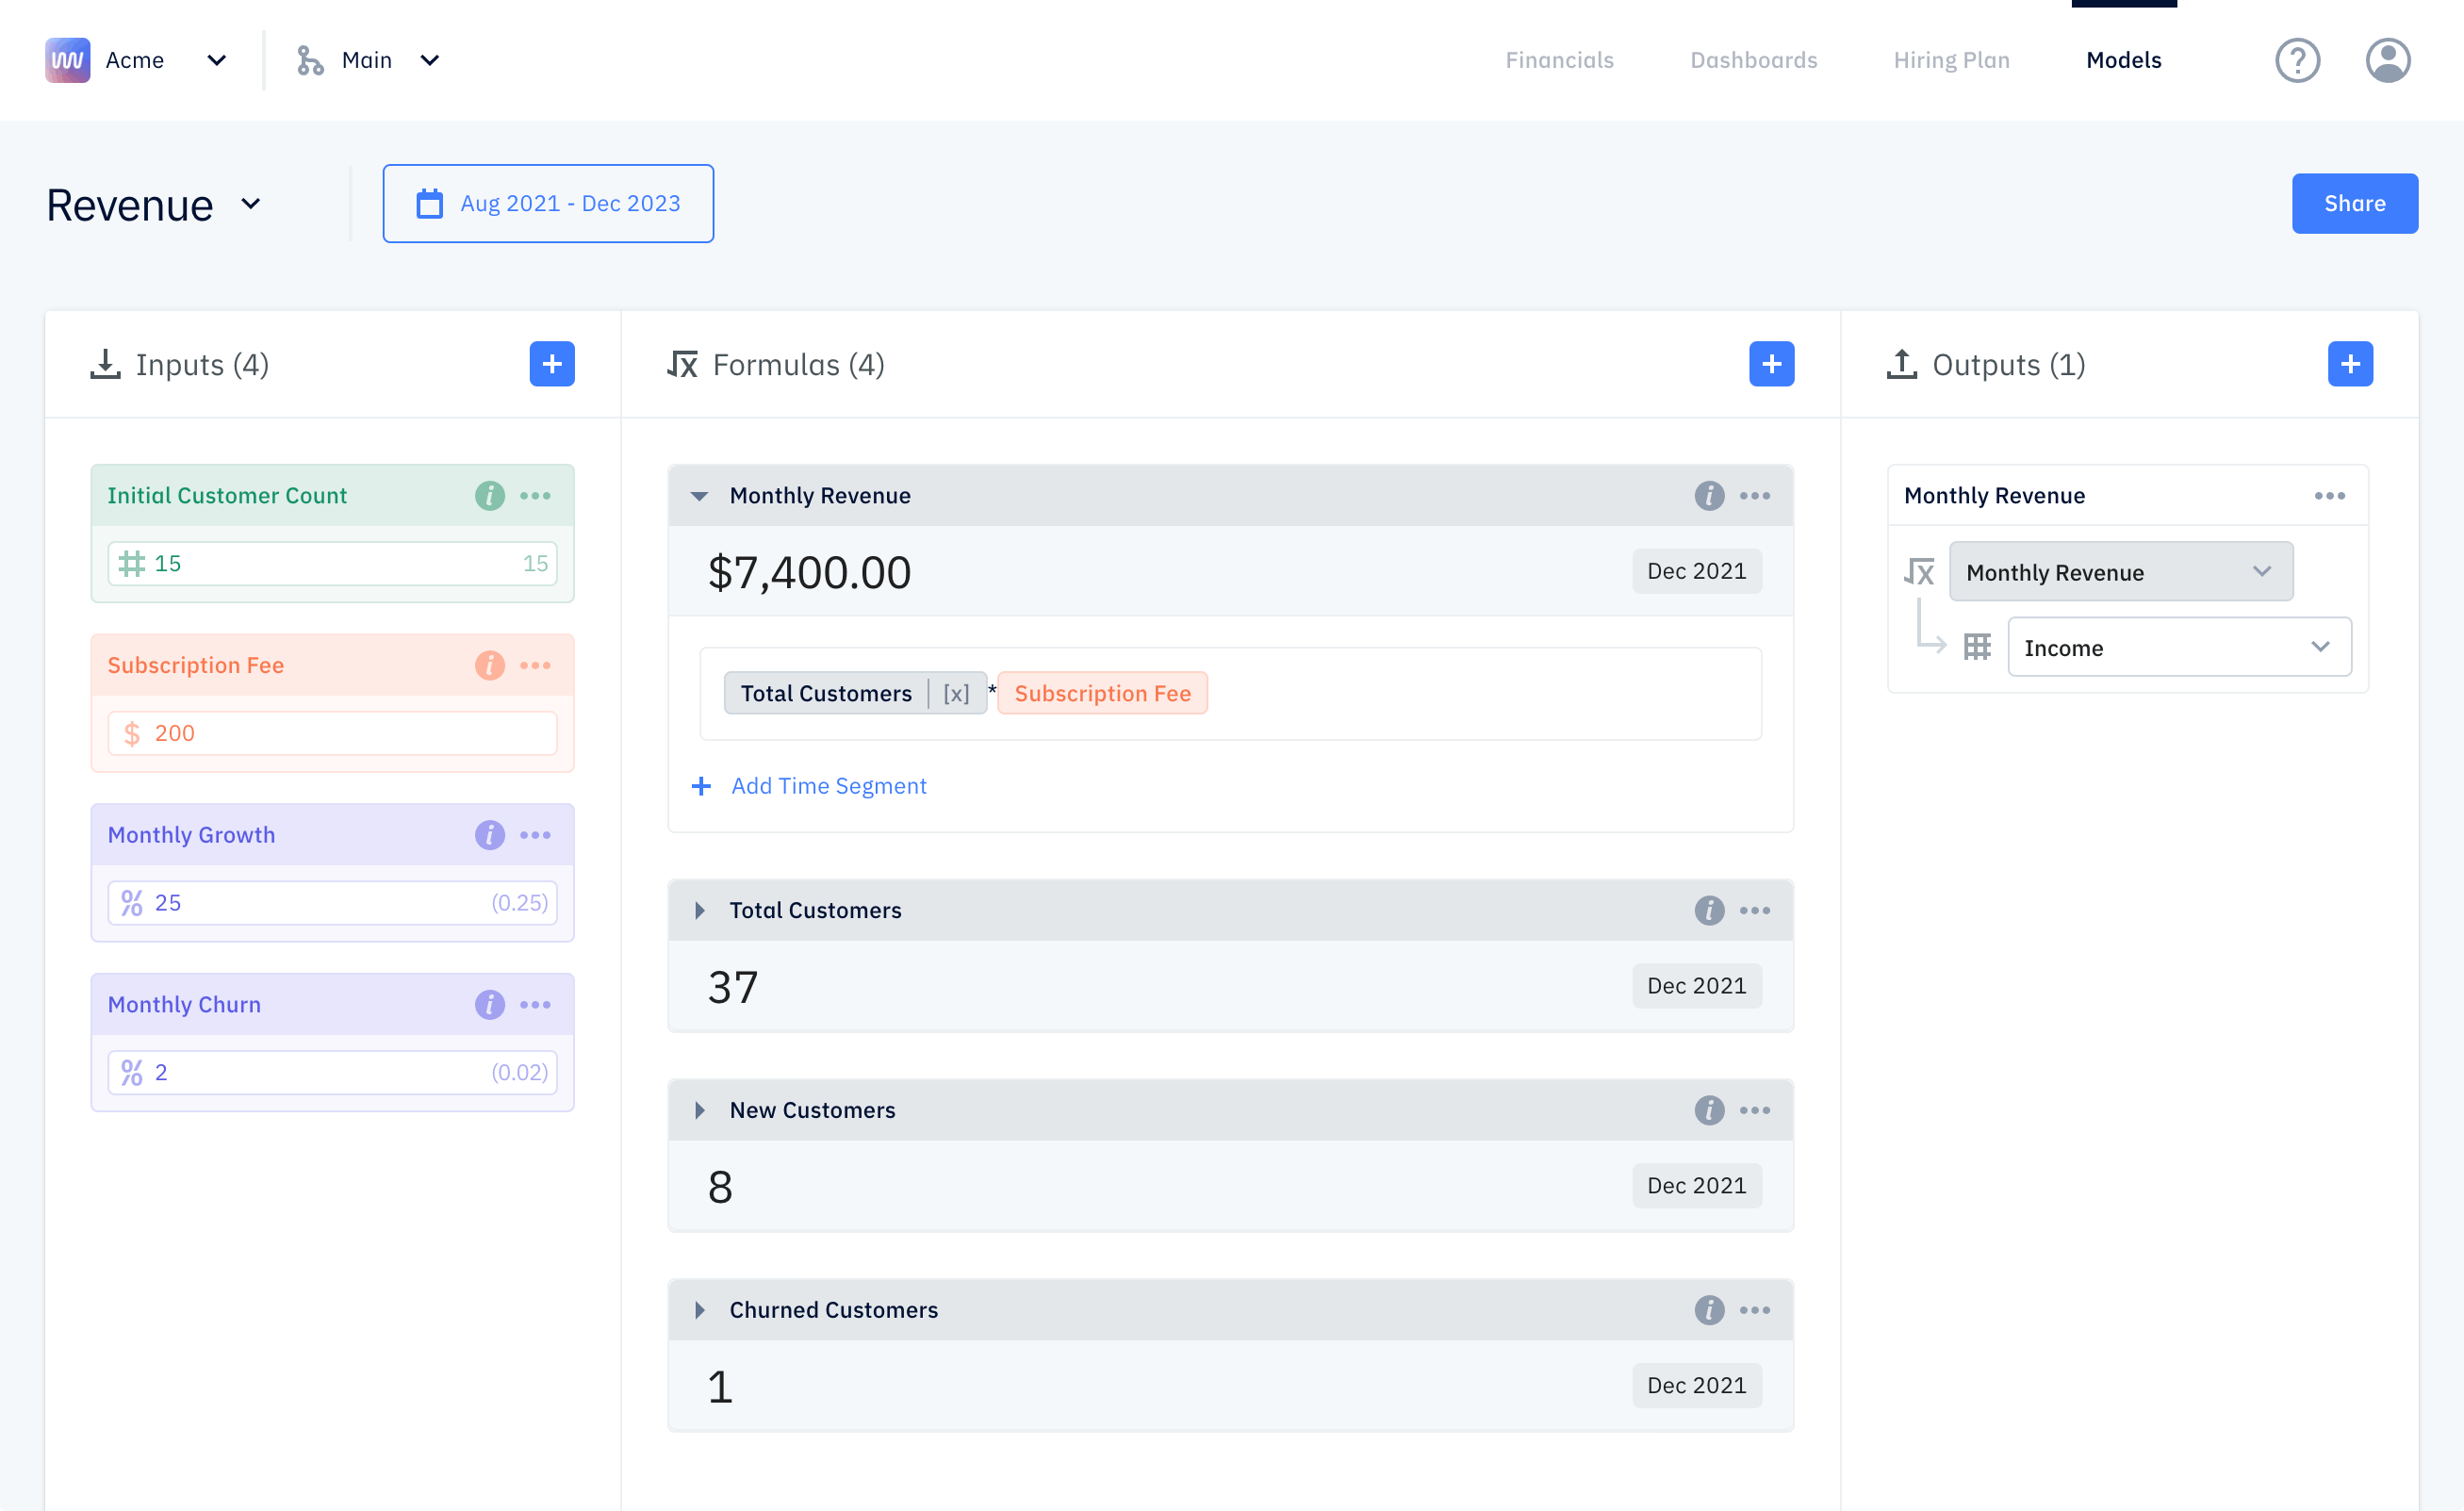
In Pry, you’ll get two pre-built models: one based on revenue and one based on expenses. Each will come with default inputs (e.g., food budget per employee, 401(k) percent of employees’ salaries).
Construct a data table
Once you know what variables you want to test, it’s time to build your dataset and the relationships (i.e., the formulas) between the different values.
“Sensitivity analysis requires that every independent and dependent variable be studied in a detailed manner. It helps to determine the association between the variables. Even better, it facilitates more accurate forecasting.” — Corporate Finance Institute
Input values
First, fill in the input values and assumptions. In other words, type all the numbers that your formula will need in order to calculate how the independent variable will affect the dependent variable. For a revenue model, your inputs would include:
- Initial number of customers
- Monthly churn rate
- Projected number of new customers per month
- Monthly subscription revenue
Now imagine a hiring scenario. What happens if you hire three more people? Daniel recommends that inputs for each hire include:
- Salary
- Benefits
- Equipment costs
- Additional office space
- Ramp-up time (e.g., when do you expect that person to perform optimally?)
- Potential severance pay if they don’t work out
In Excel, you need to insert these numbers and build the formulas manually (e.g., New MRR = new customers * average revenue per new customer).
In Pry, this process is more intuitive and easier to replicate. Pry provides pre-built functions and default formulas (e.g., projected revenue = number of customers * monthly contract value). Then you can customize, add, and delete inputs and formulas as needed.
Save the original before making any changes to variables
You should save your original scenario’s data and formulas, so you can go back to them after testing changes to the different variables.
In Excel, on the Data tab, select “What If Analysis” and then “Scenario Manager" to save your original scenario. When the Scenario Values dialog box pops up, don’t change anything. Remember, this scenario is the original — before you change any variables.
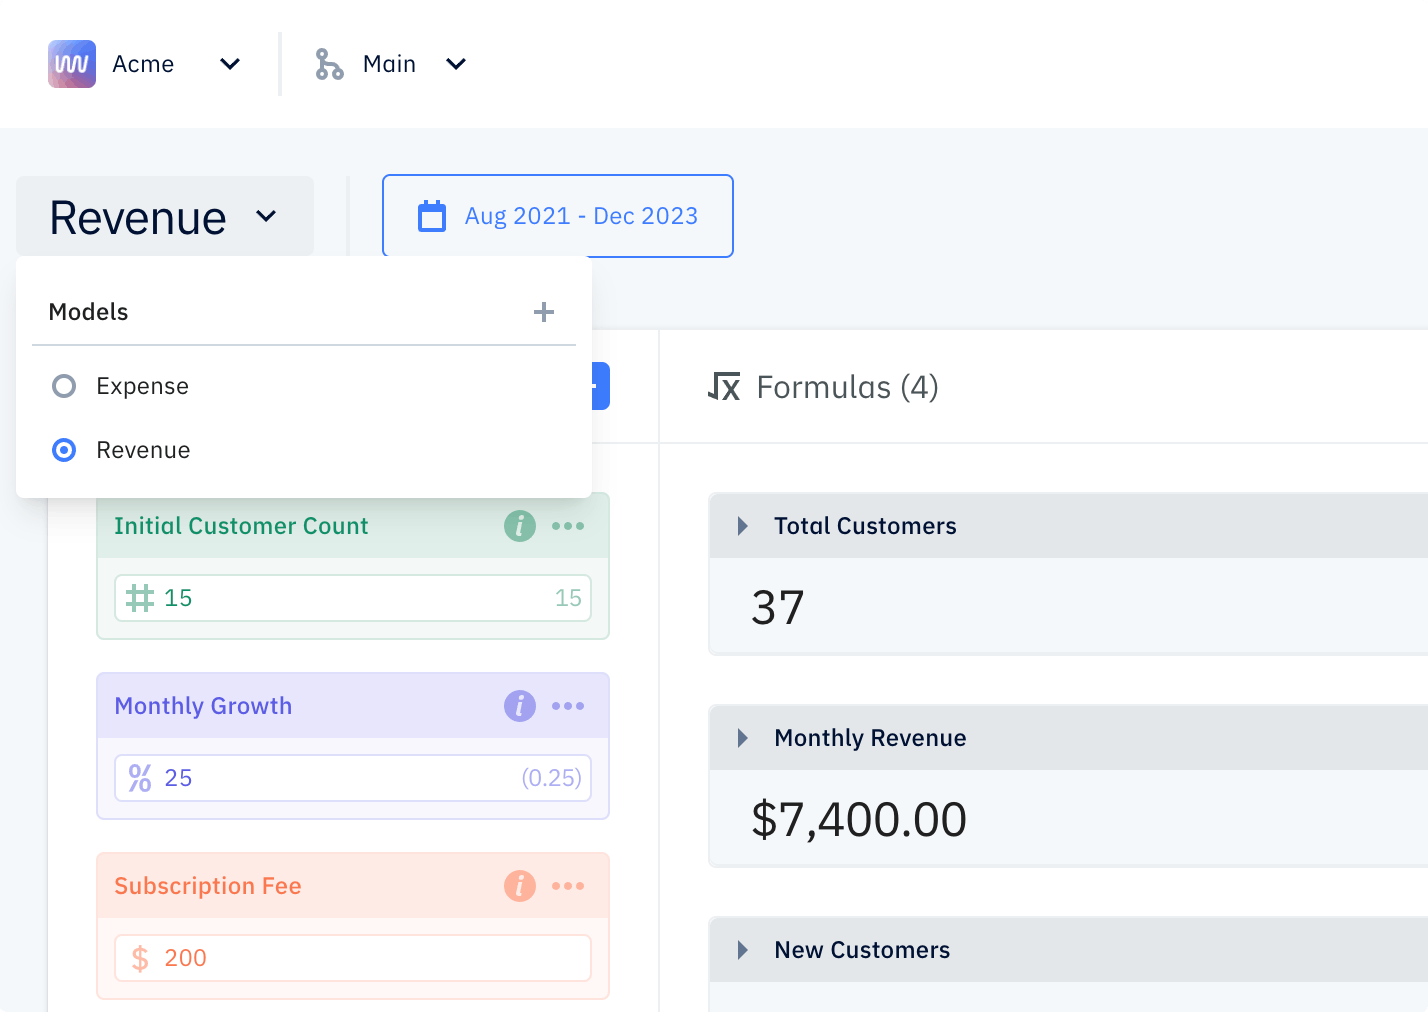
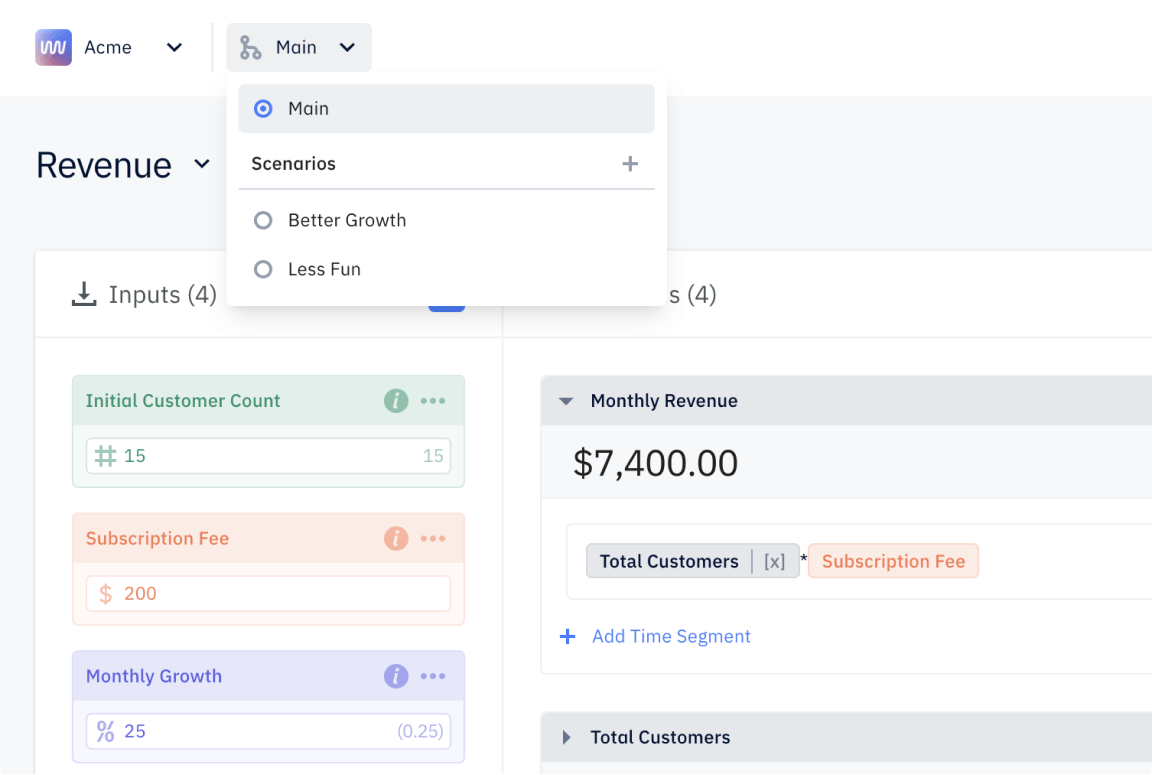
In Pry, saving the original is automatically done for you. You can create multiple financial models and scenarios without messing up your original (called “Main” in Pry). Plus, you can seamlessly switch between the different scenarios and models by selecting the option you want from the dropdown.
Add a range of possible scenarios
Remember to create multiple scenarios. Rather than predicting one outcome for a given variable, you should include a range of possible outcomes. At the very least, you should include a base-case (average), worst-case, and best-case scenario.
Best-case scenario (example)
Christmas is coming soon, and people will be shopping more. An increase in traffic (in person or online) can be predicted based on the previous year’s Christmas season. You can use a what-if analysis to predict how much more sales revenue your company will generate over the holiday season “if customer traffic increases by 20%, 40%, or 100%.”
Worst-case scenario (example)
You want to launch a new product or feature, but customer adoption could be slow at first. You can use a what-if analysis to predict how long it will take to turn a profit by weighing low product adoption of the new product vs. past customer purchase data.
If you don’t know where to begin, start by changing something that you already know affects the variable you want to predict. For example, if you’re trying to predict how you could increase MRR, start playing with the monthly new customer growth rate.
“There is a big difference between changing inputs that are known to have a causal relationship and merely going on a fishing expedition to figure out what might work.” — Joel Shapiro, Chief Analytics Officer at Varicent
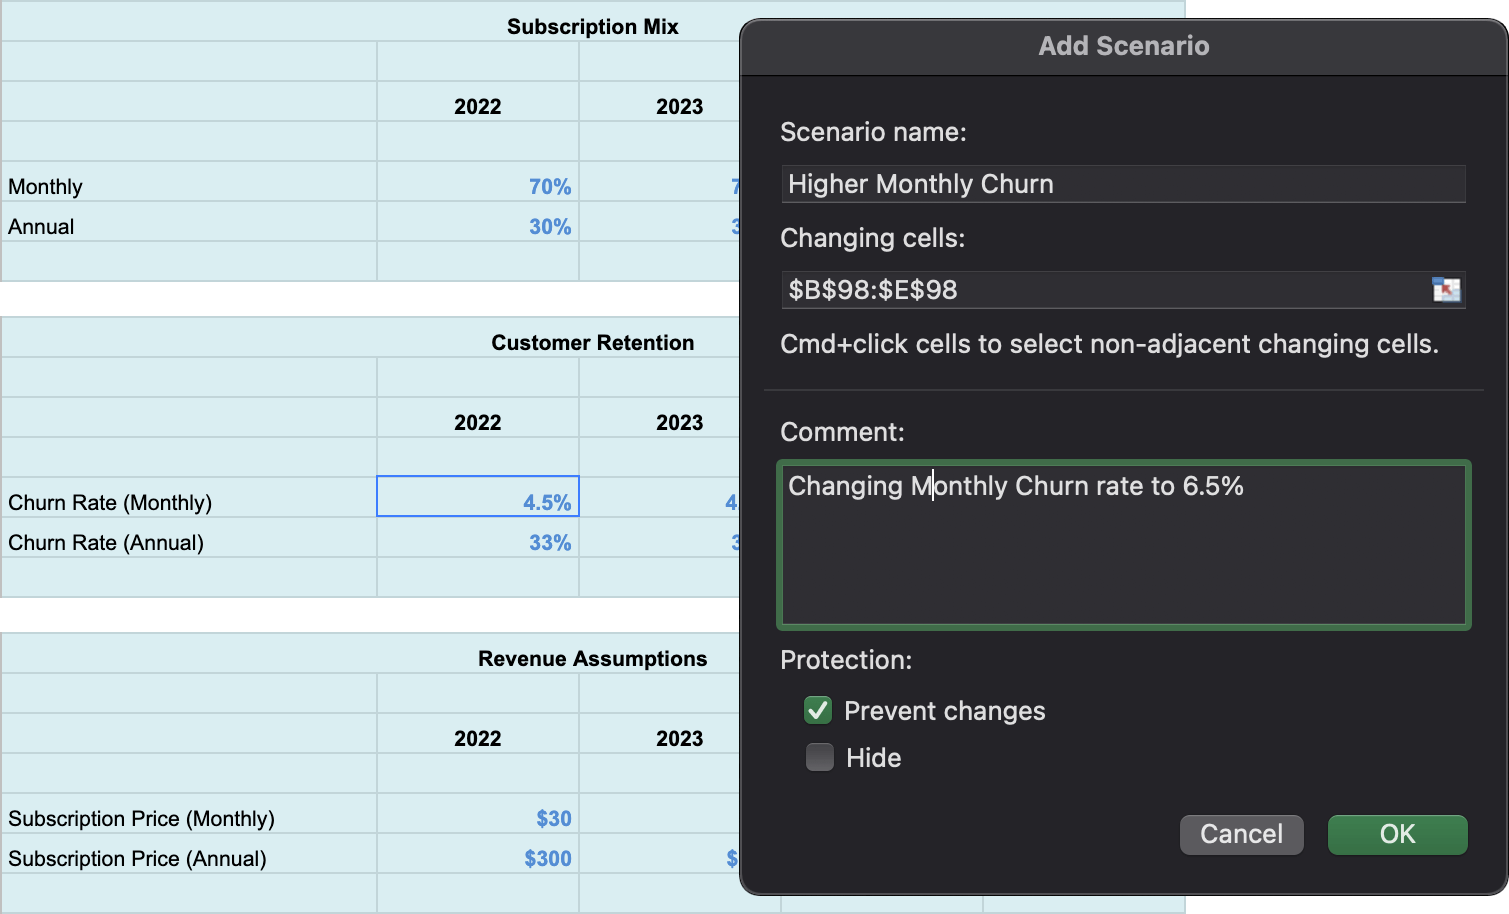
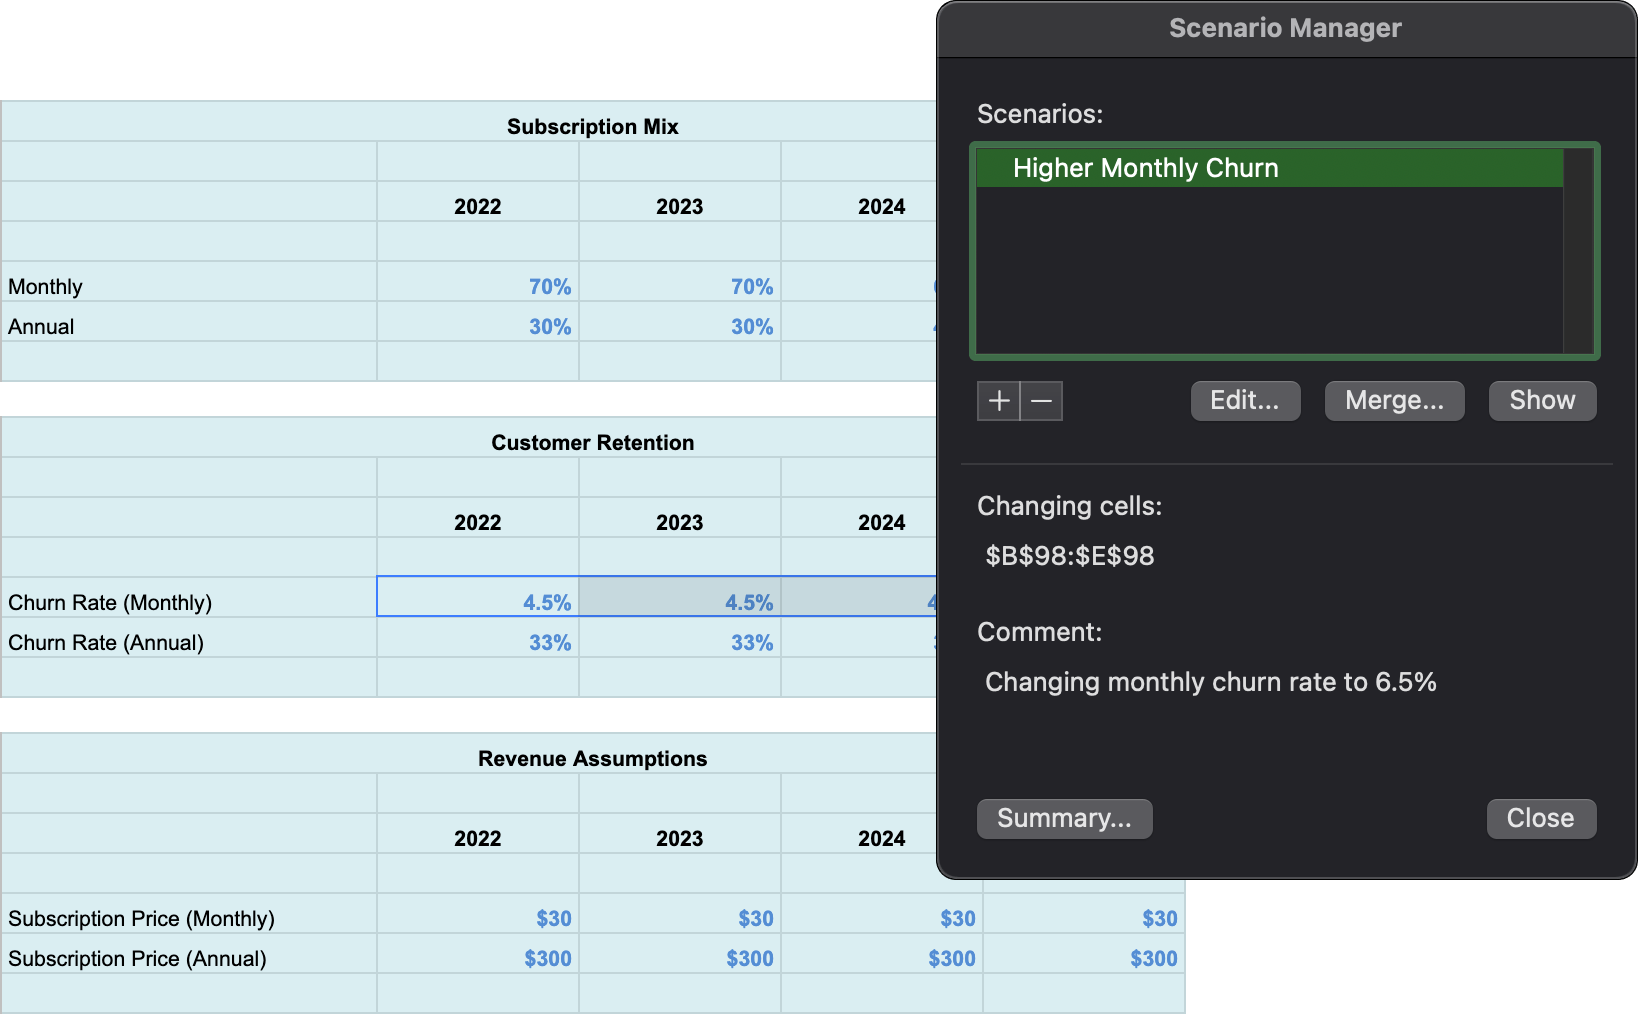
In Excel, you can create new scenarios the same way you saved your original. On the Data tab, select “What If Analysis,” then “Scenario Manager," and then "Add." Leave the "Changing cells" field the same as your original because your formulas will reference that same data. Then create a new Scenario Name and add any relevant details in the Comment field.
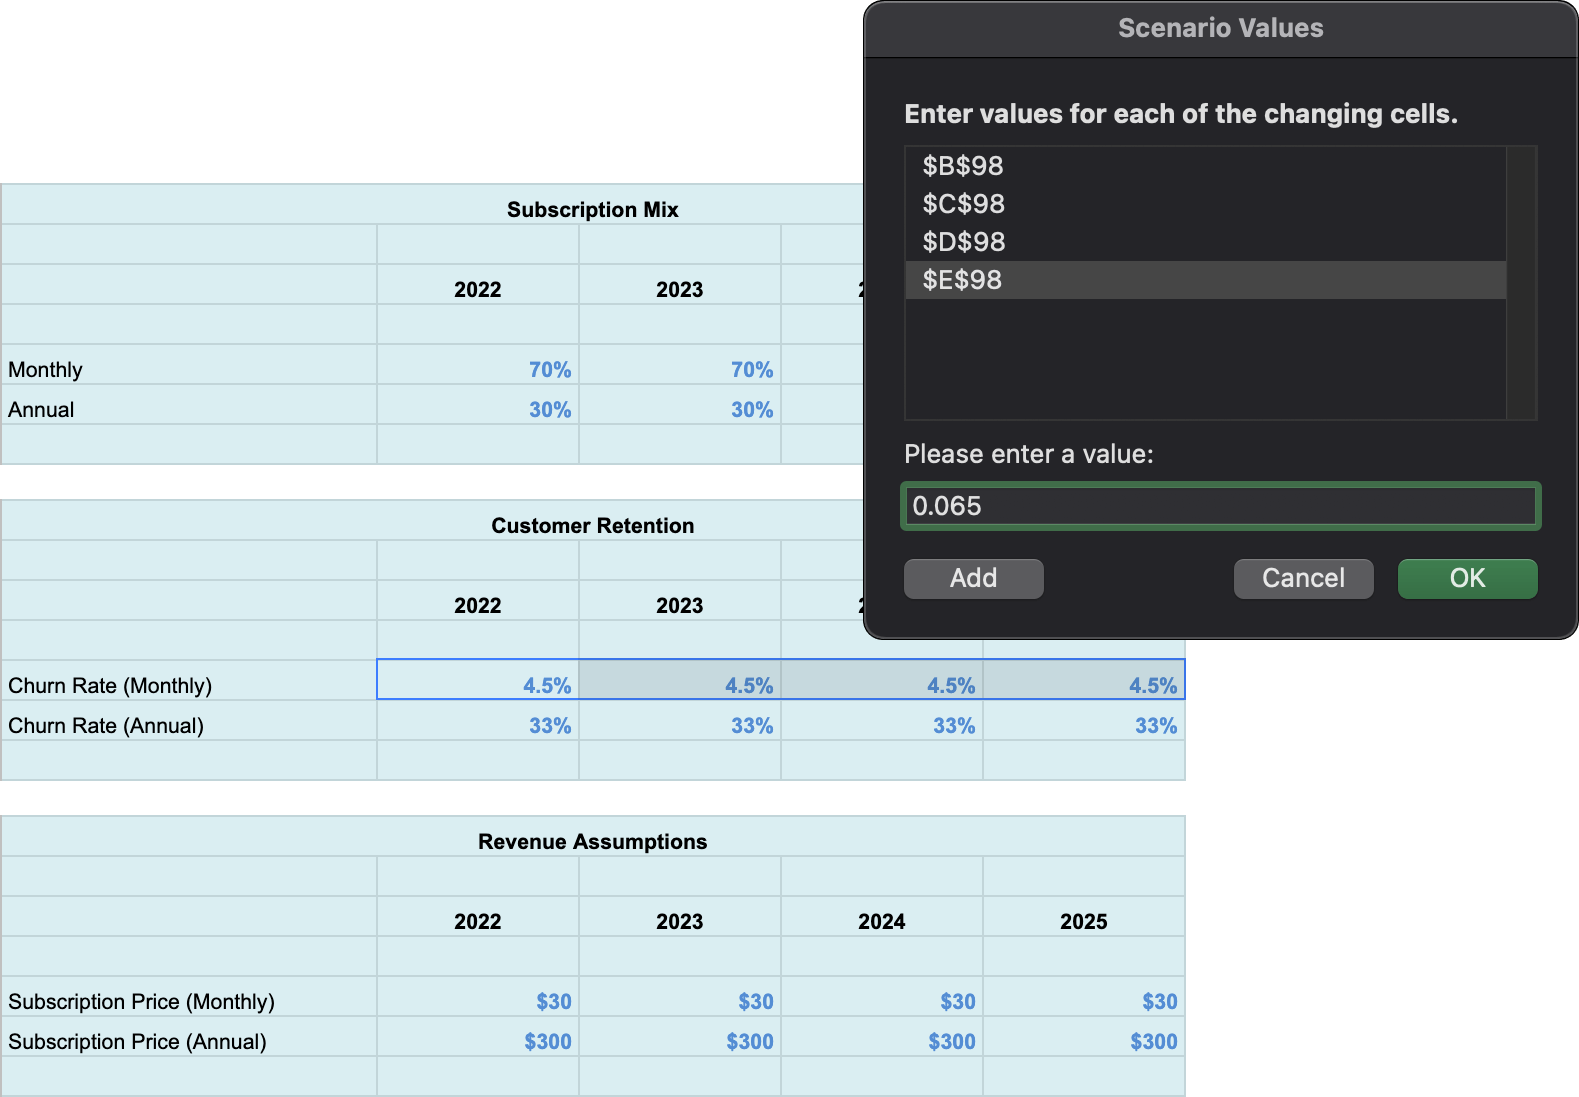
When the Scenario Values dialog box comes up, you should change one or more variables that are appropriate for the scenario you are trying to build. For example, if you are building a best-case scenario for a subscription revenue model, you will want to increase the monthly growth rate percentage.
In Pry, you can create new scenarios by selecting the + icon from the dropdown. When the New Branch dialog box comes up, name your scenario in the Branch Name field and select Create Branch.
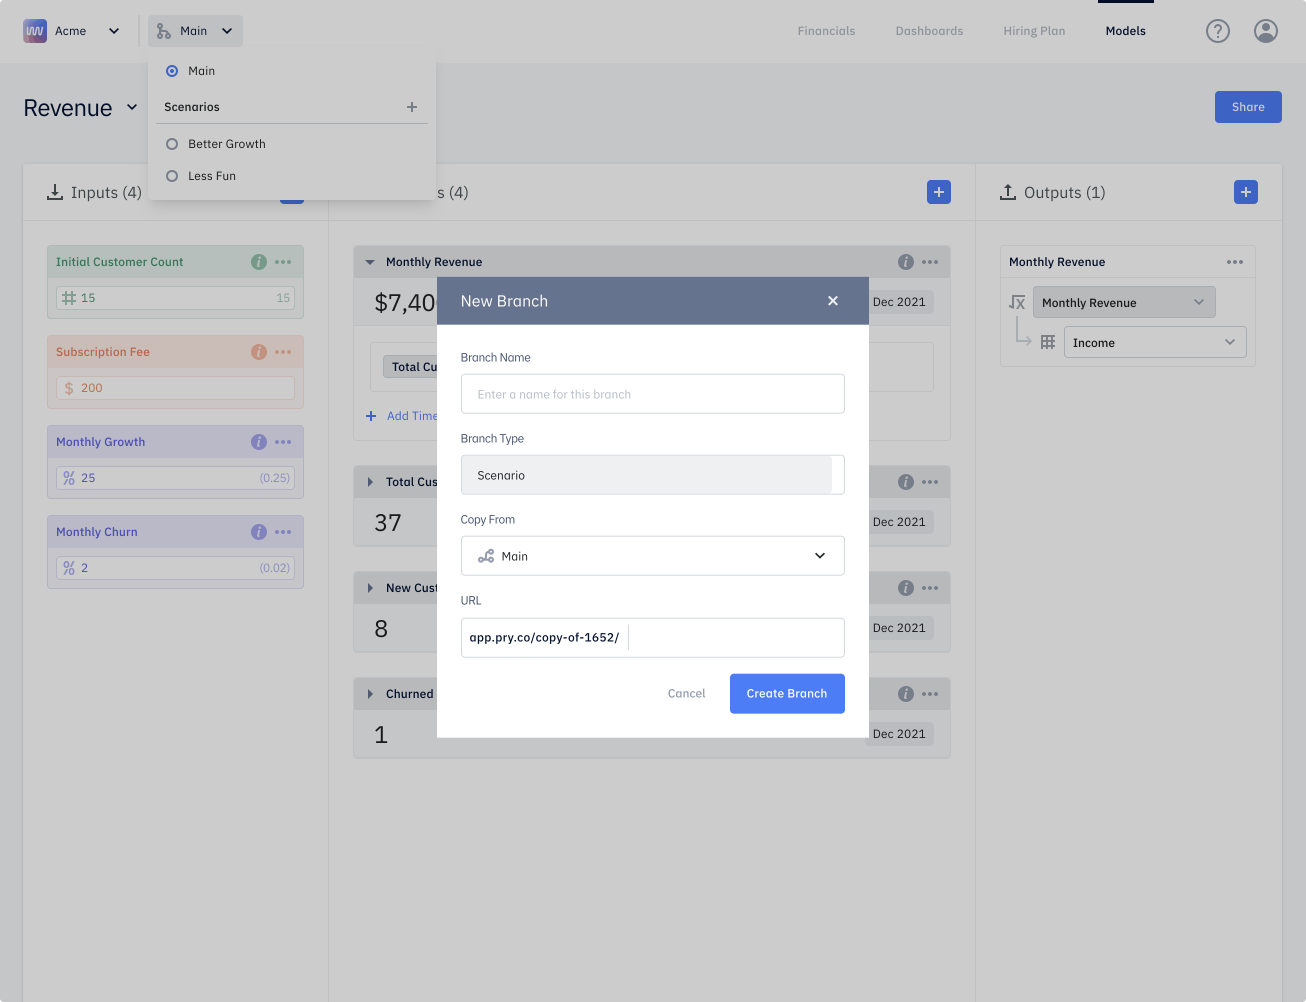
Your new scenario will appear in the dropdown. Once you select the new scenario you just created, you can change one or more variables, add inputs, and tweak formulas as necessary.
Manage uncertainties with a what-if analysis
Now that you know the basics of how to perform a what-if analysis, you can make better decisions based on what could happen in the future. Still scratching your head? Get a more detailed tutorial of Pry’s Scenario Planning for free, or get personalized help building your financial model in Pry for $500. Obviously, we think Pry’s visuals are easy on the eyes, and we predict our software will make your next what-if analysis a much better experience than trying to wrestle with a spreadsheet.
