Quarterly & Annual Summaries
Learn how to change your report view on Pry to quarterly or annual reports.
Financial Report
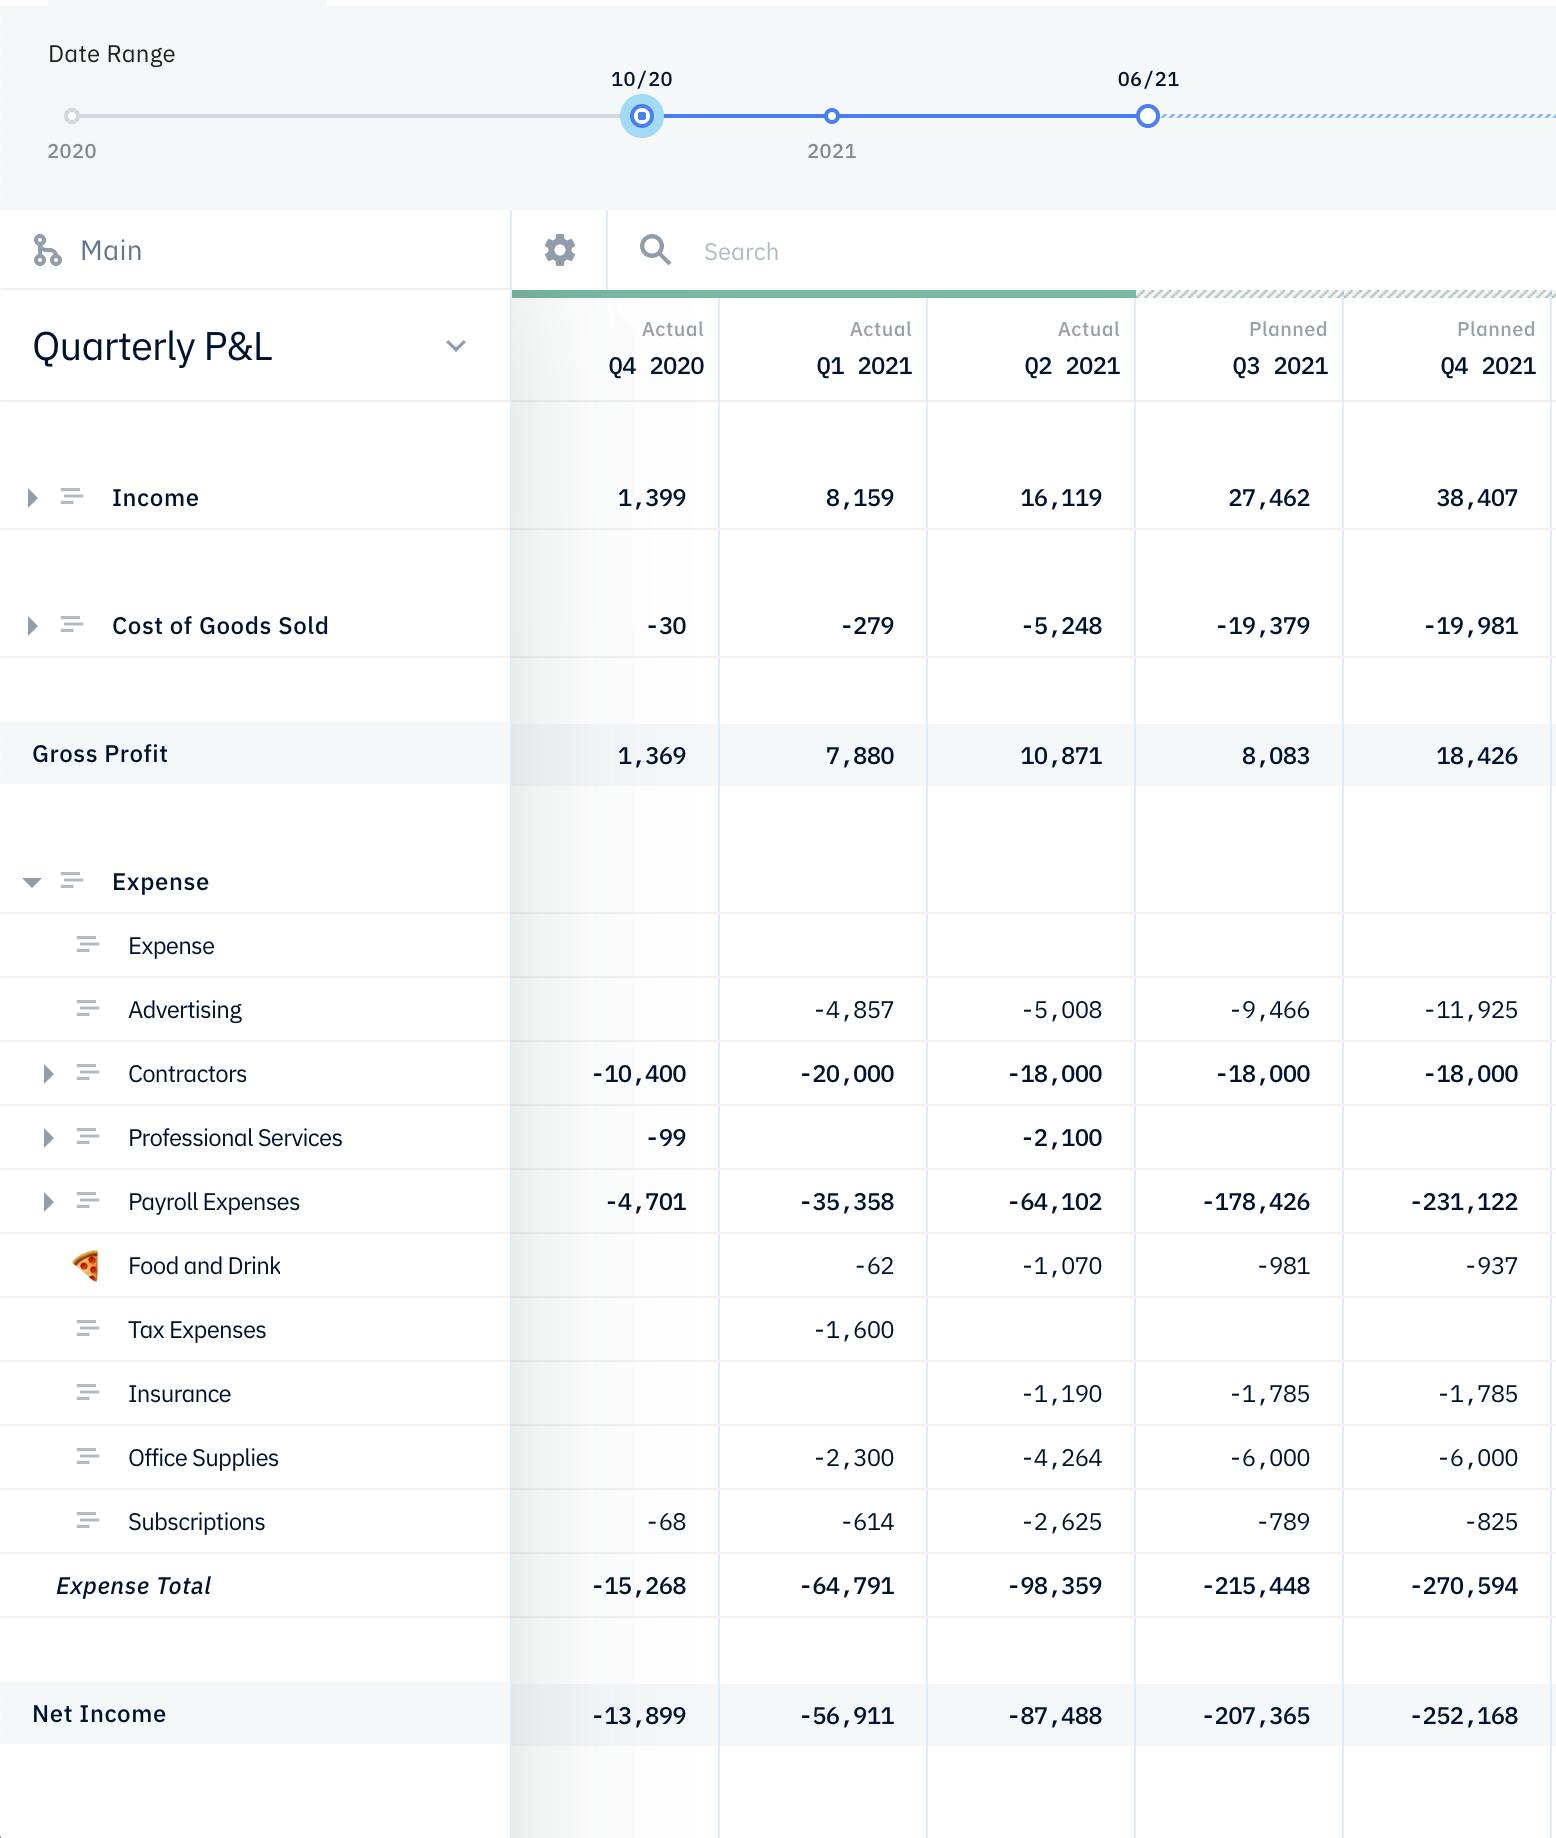
After setting up your financial plan, you can summarize the information for quarterly reports or create annual pro-forma financial statements. From your Financial Report view, click on the gear icon next to the Search Bar Field. Afterwards, you can toggle Quarterly or Annual Summaries on. You can also adjust the date range selector to change the time periods displayed on the Financial Report.
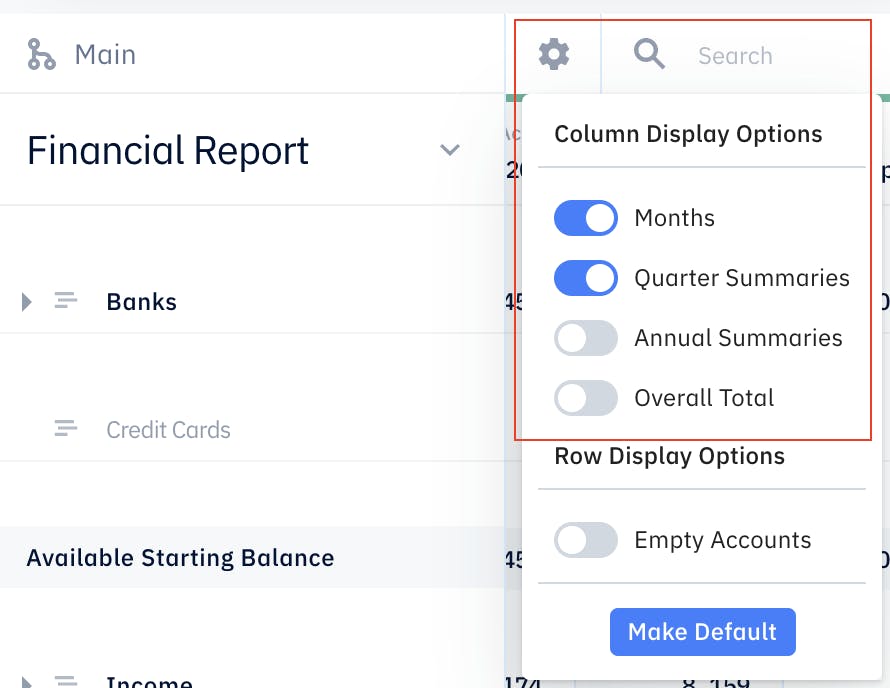
This will consolidate your monthly numbers and display a summary of your Financial Report depending on your settings. If you'd like to save this setting as default, click on the "Make Default" icon otherwise, it will revert back to the Monthly view next time you refresh the page. You can also use this setting for other type of reports. Click on the drop down arrow next to Financial Report to create a custom report.
Important Note:You cannot adjust forecast entries on quarterly or annual summary cells. If you need to make adjustments to your forecast entries, make sure to toggle Months on and edit the forecast entry on the respective Month columns.
Forecasts vs Actuals
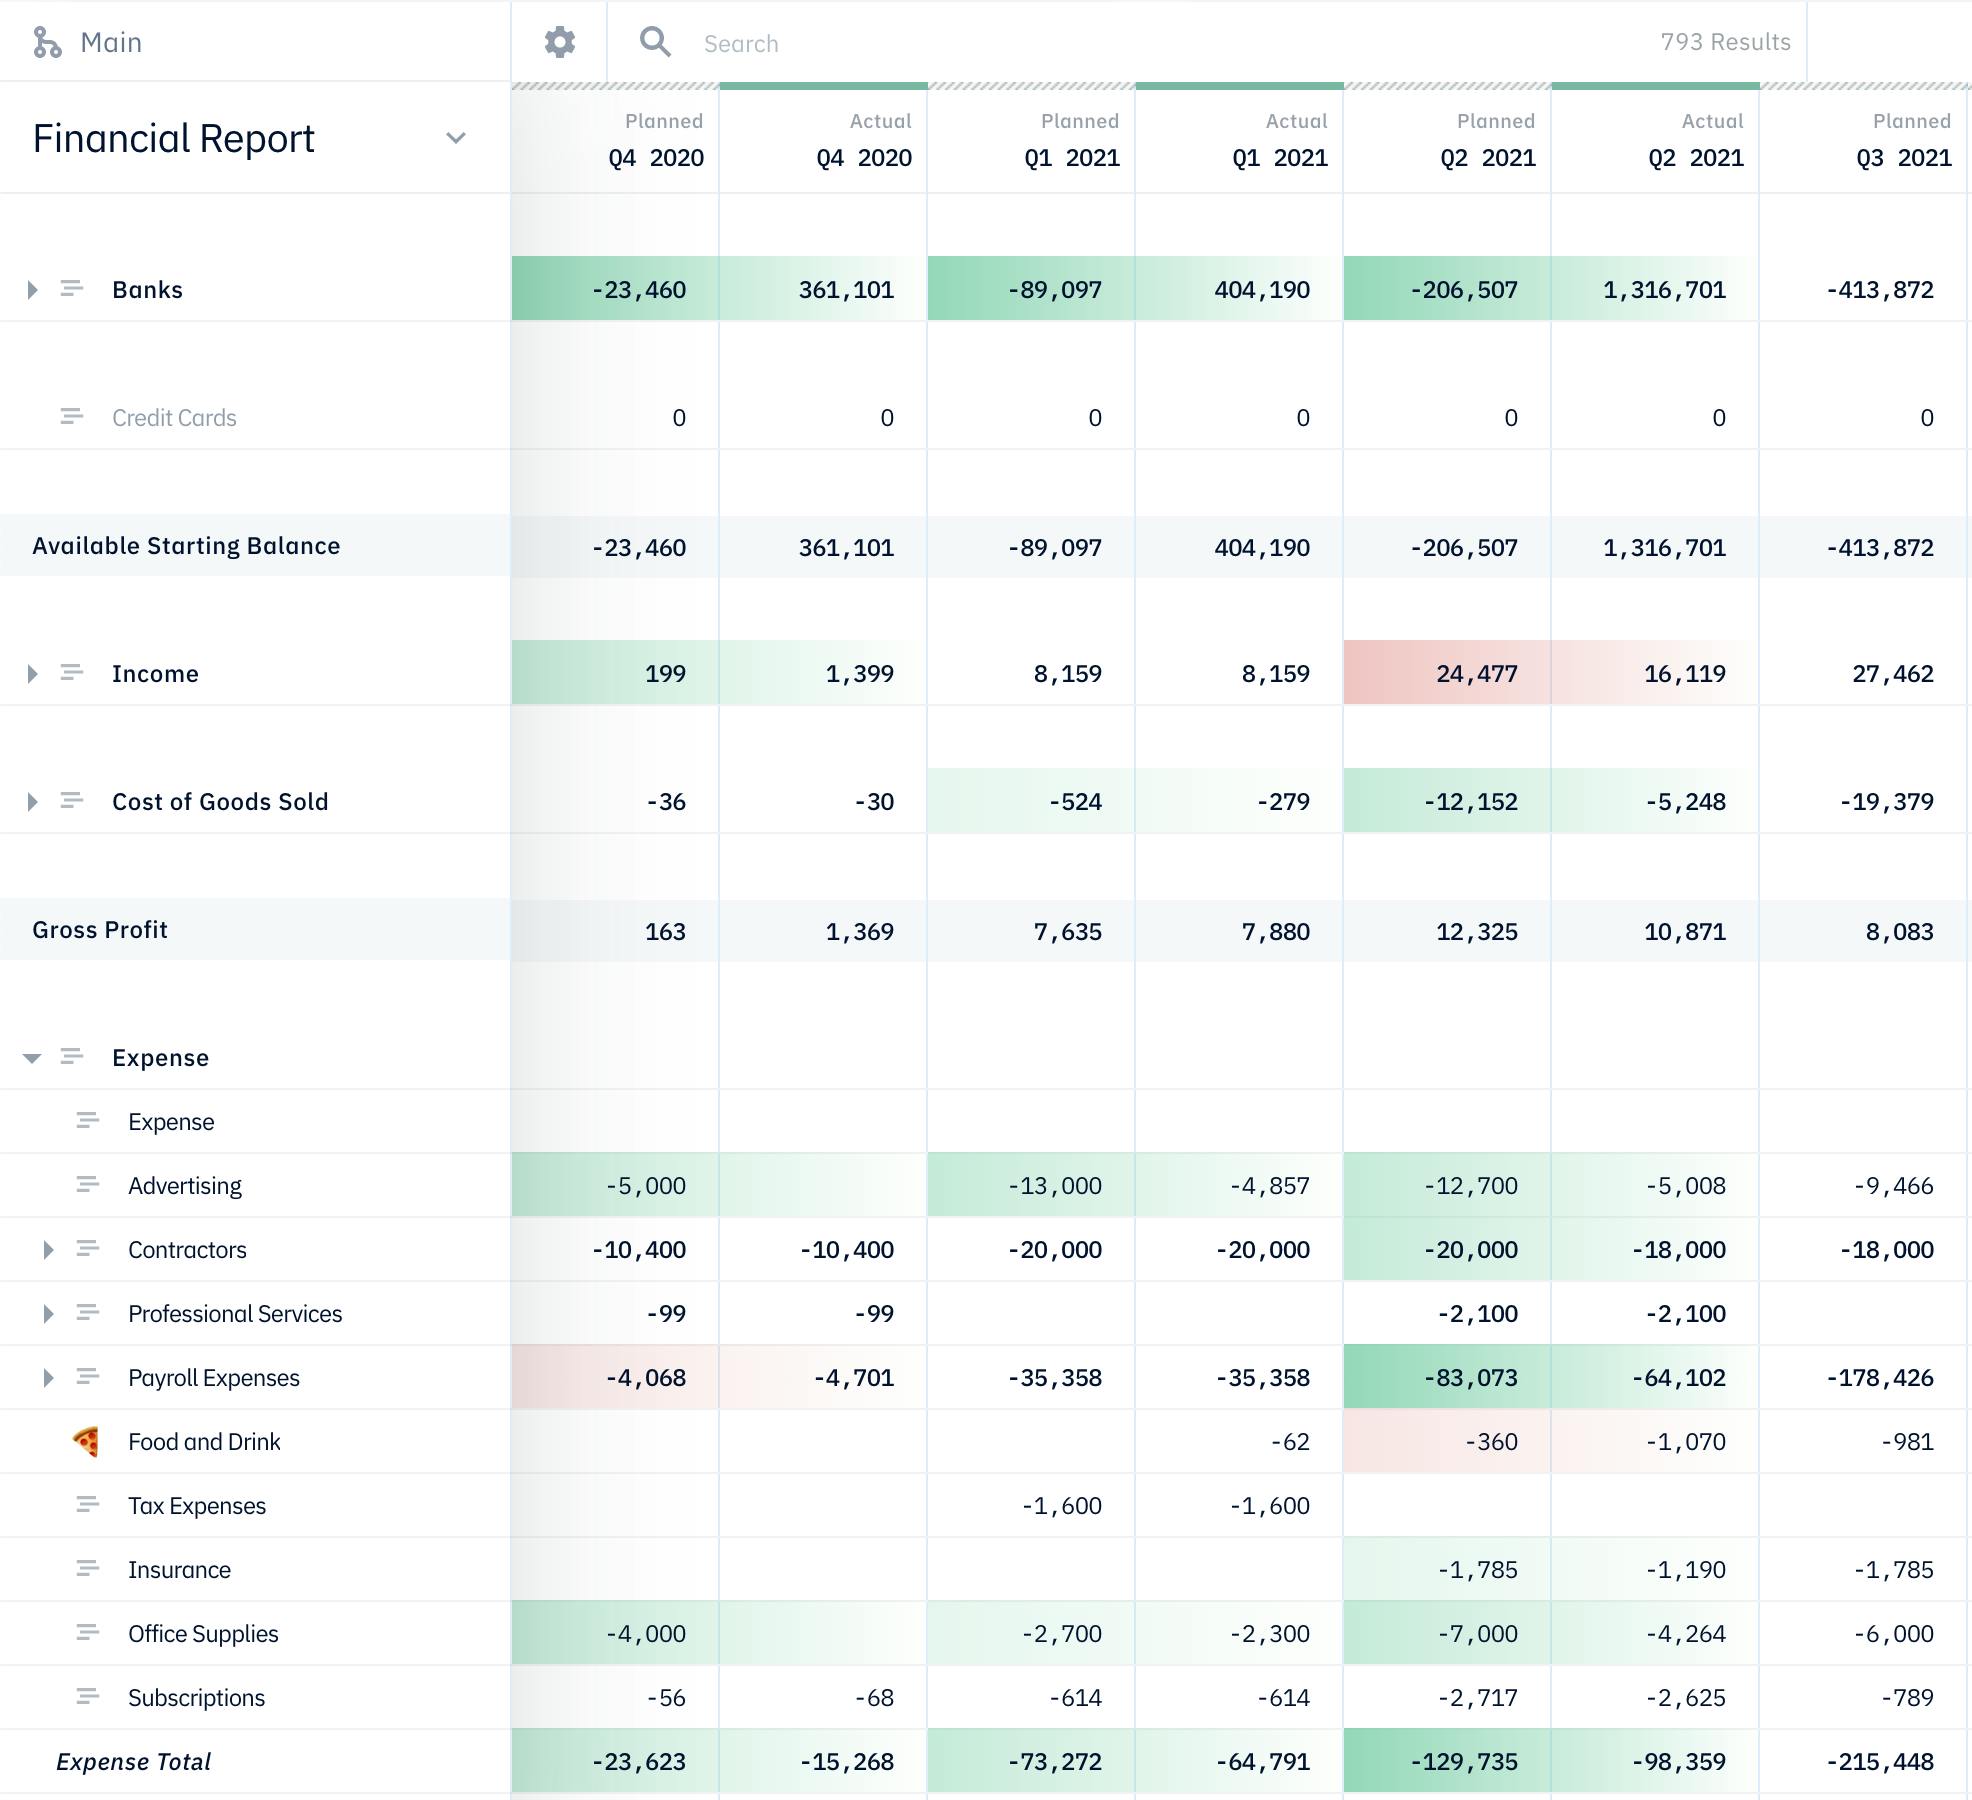
In addition to our automated Forecast vs Actual monthly review feature, you can also do it for Quarterly and Annual views. Simply set the settings you want to view when you click on the Forecasts vs Actuals tab and remember to click on the arrow on the starting period column to select the start date period for a Forecasts vs Actual comparison.
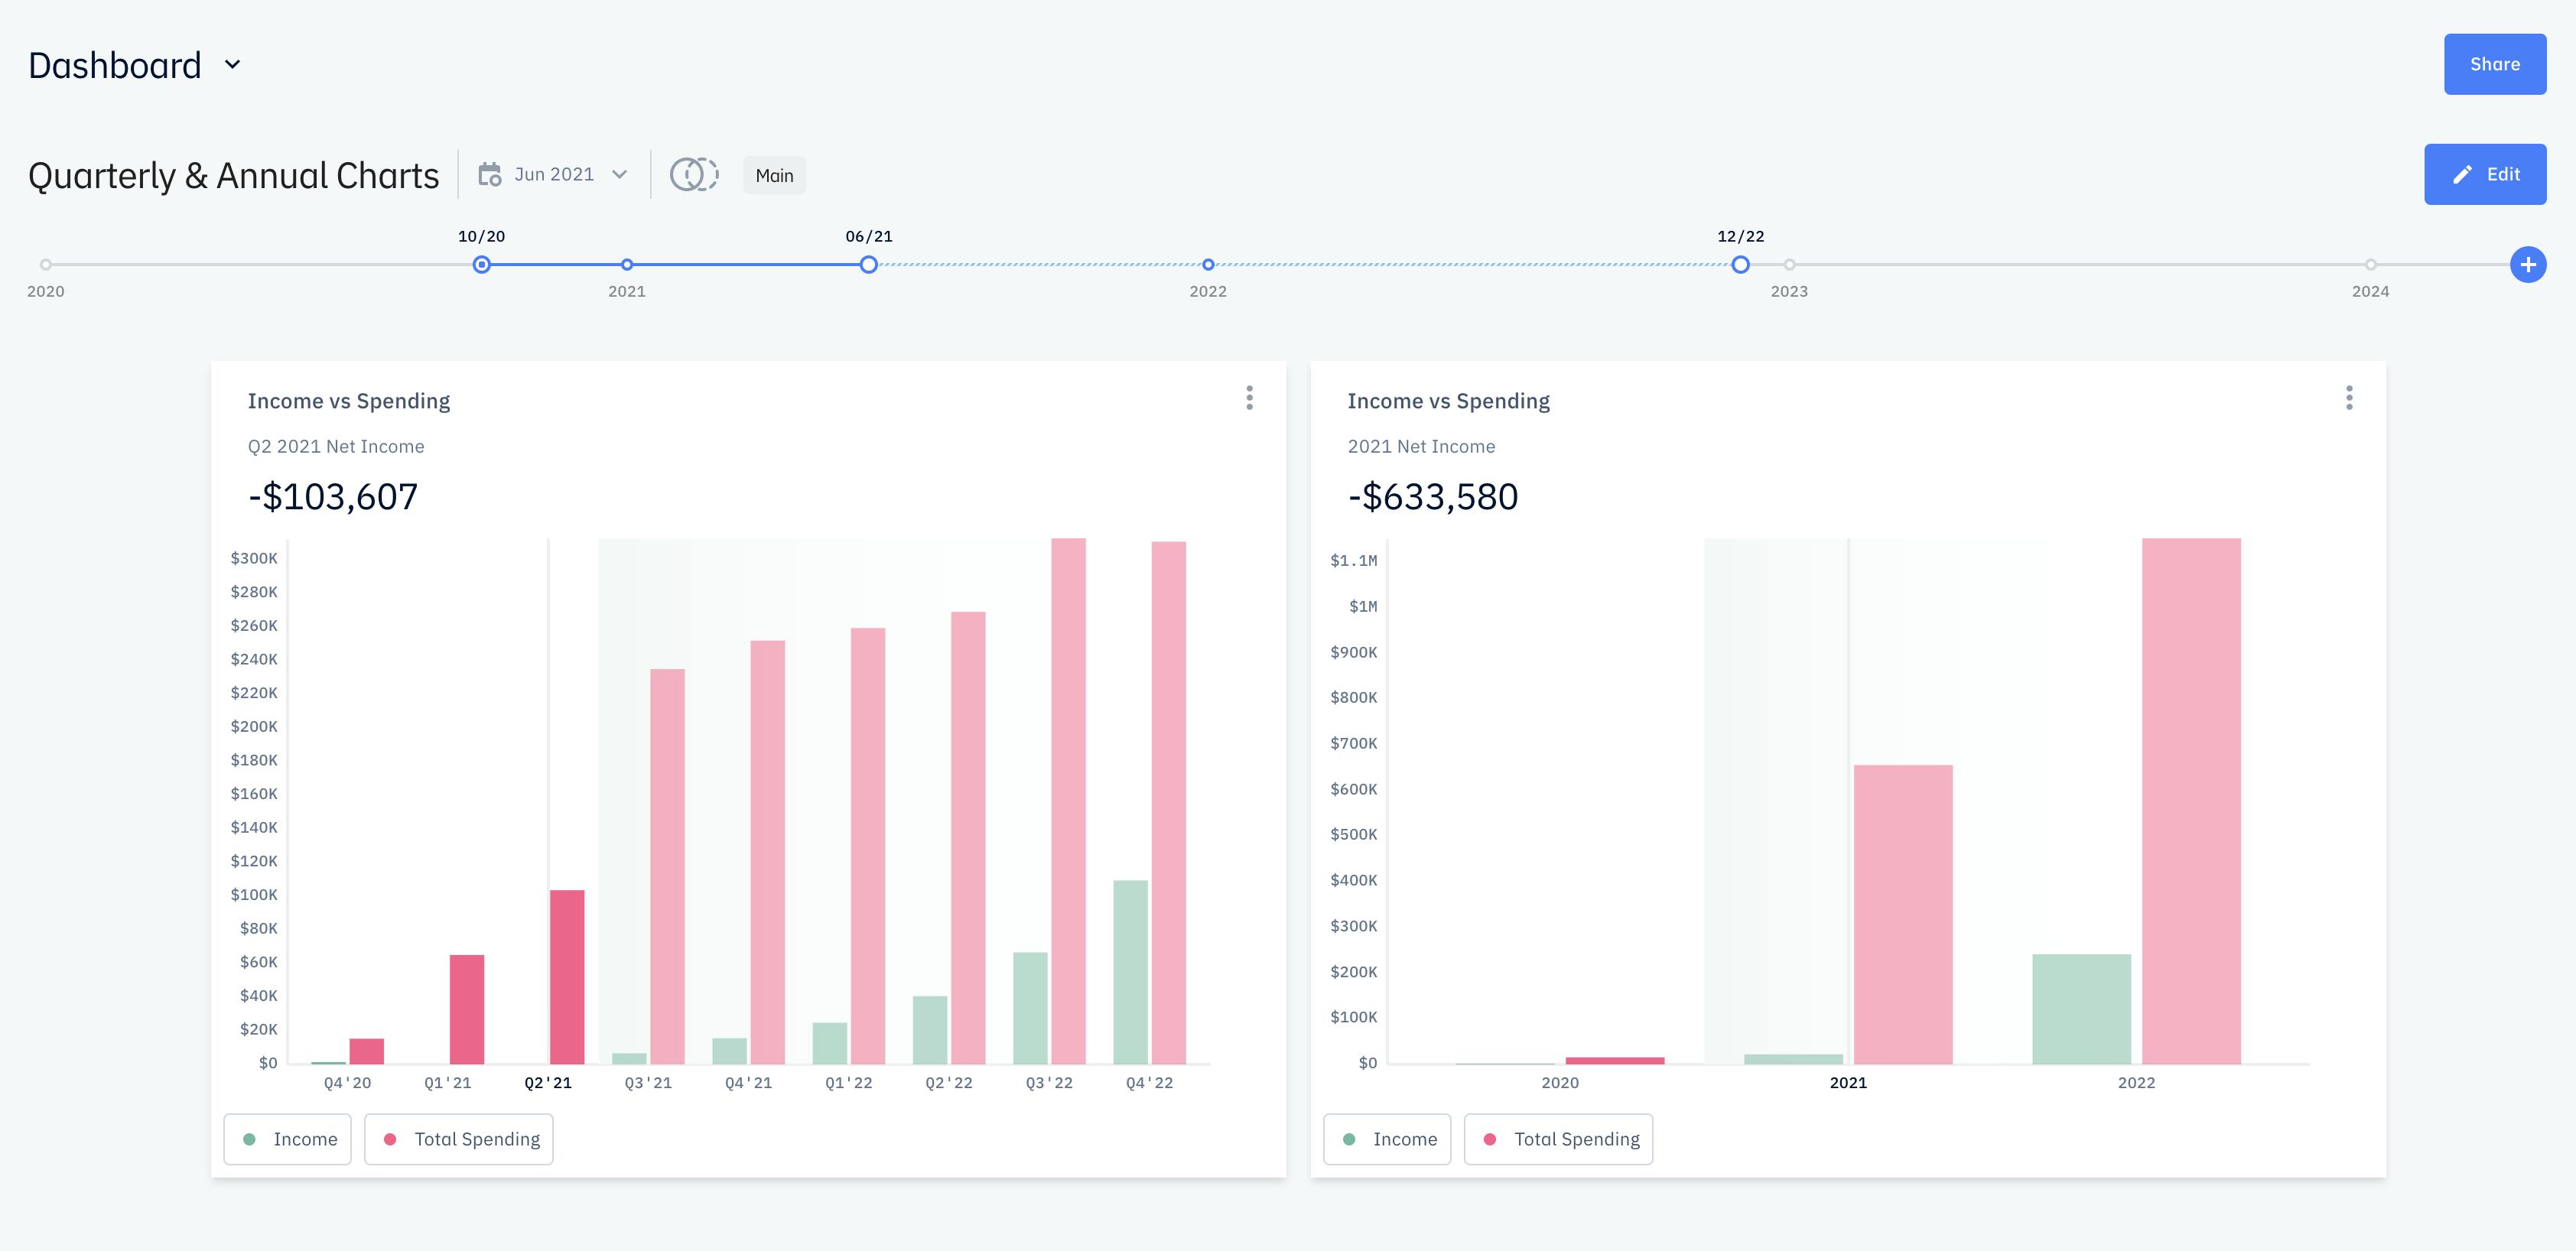
Dashboard Charts
You can also set your dashboard charts to display quarterly and annual numbers. When creating charts on your Dashboard, there is an option called Time Periods where you can select Quarterly or Annual.
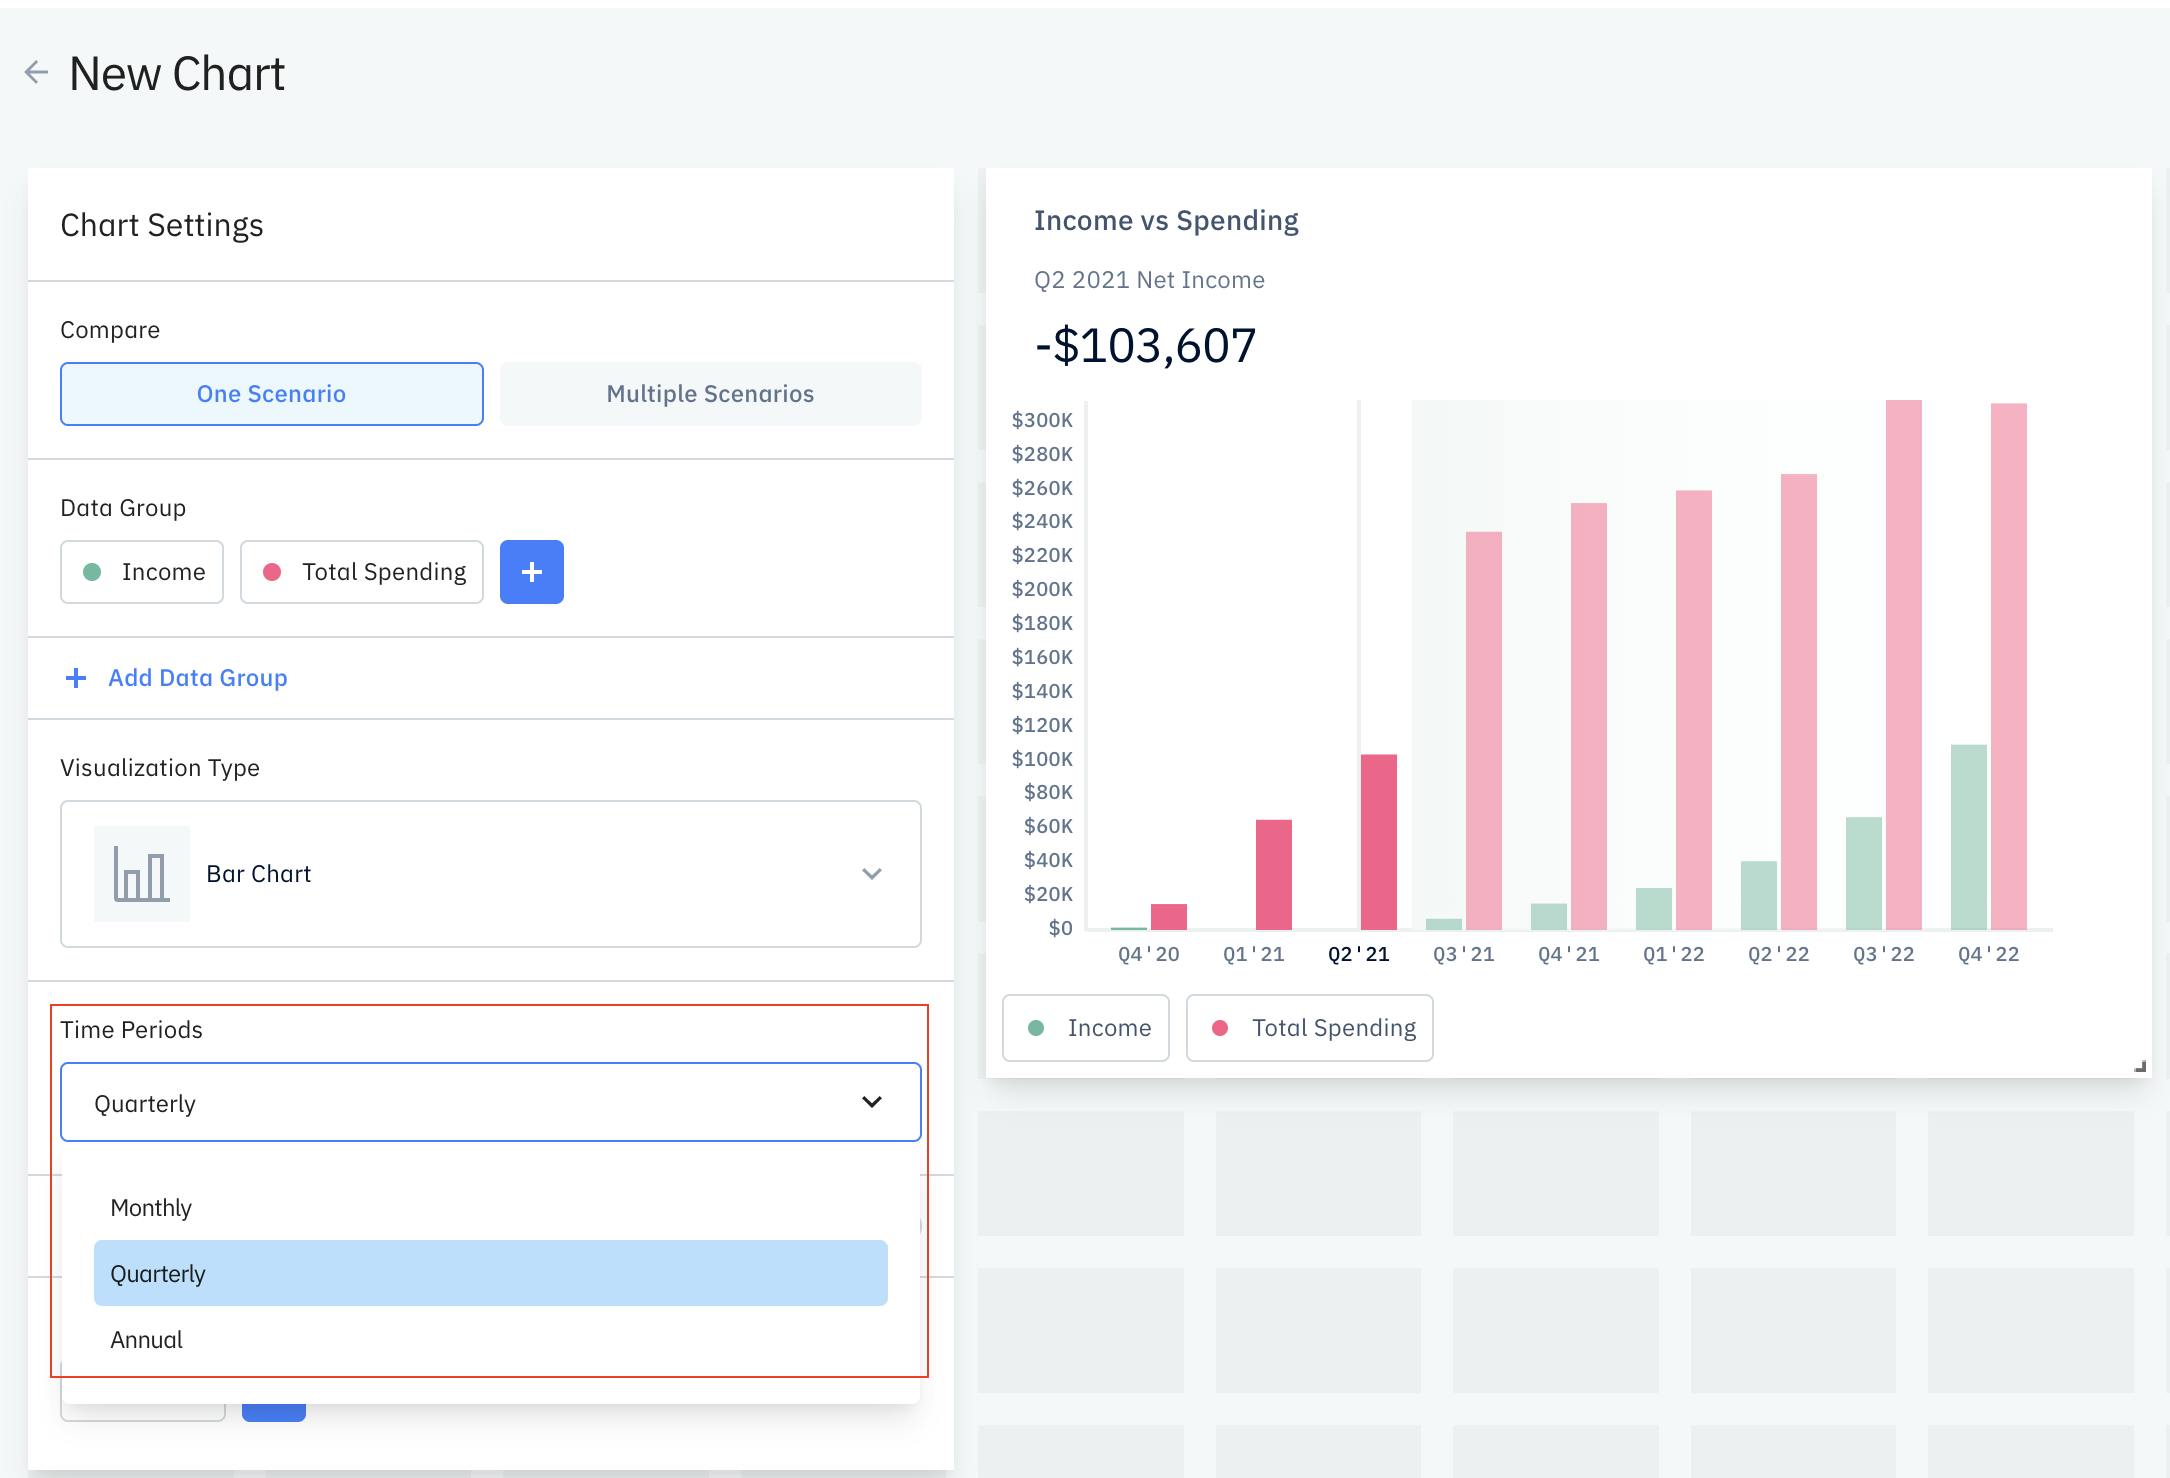
TipHaving these quarterly or annual charts are good to summarize financial data from specific timeframes and share it with other key stakeholders.